
With Earl’s Bodacious HAMA Indicator in the Mini NASDAQ Futures Market
5 trades today: 4 Winners, 1 Loser
After evaluating premarket volatility, I set my ATM to use a 20-point stop-loss and a 20-point profit-target. And all my trades were just one-position trades.
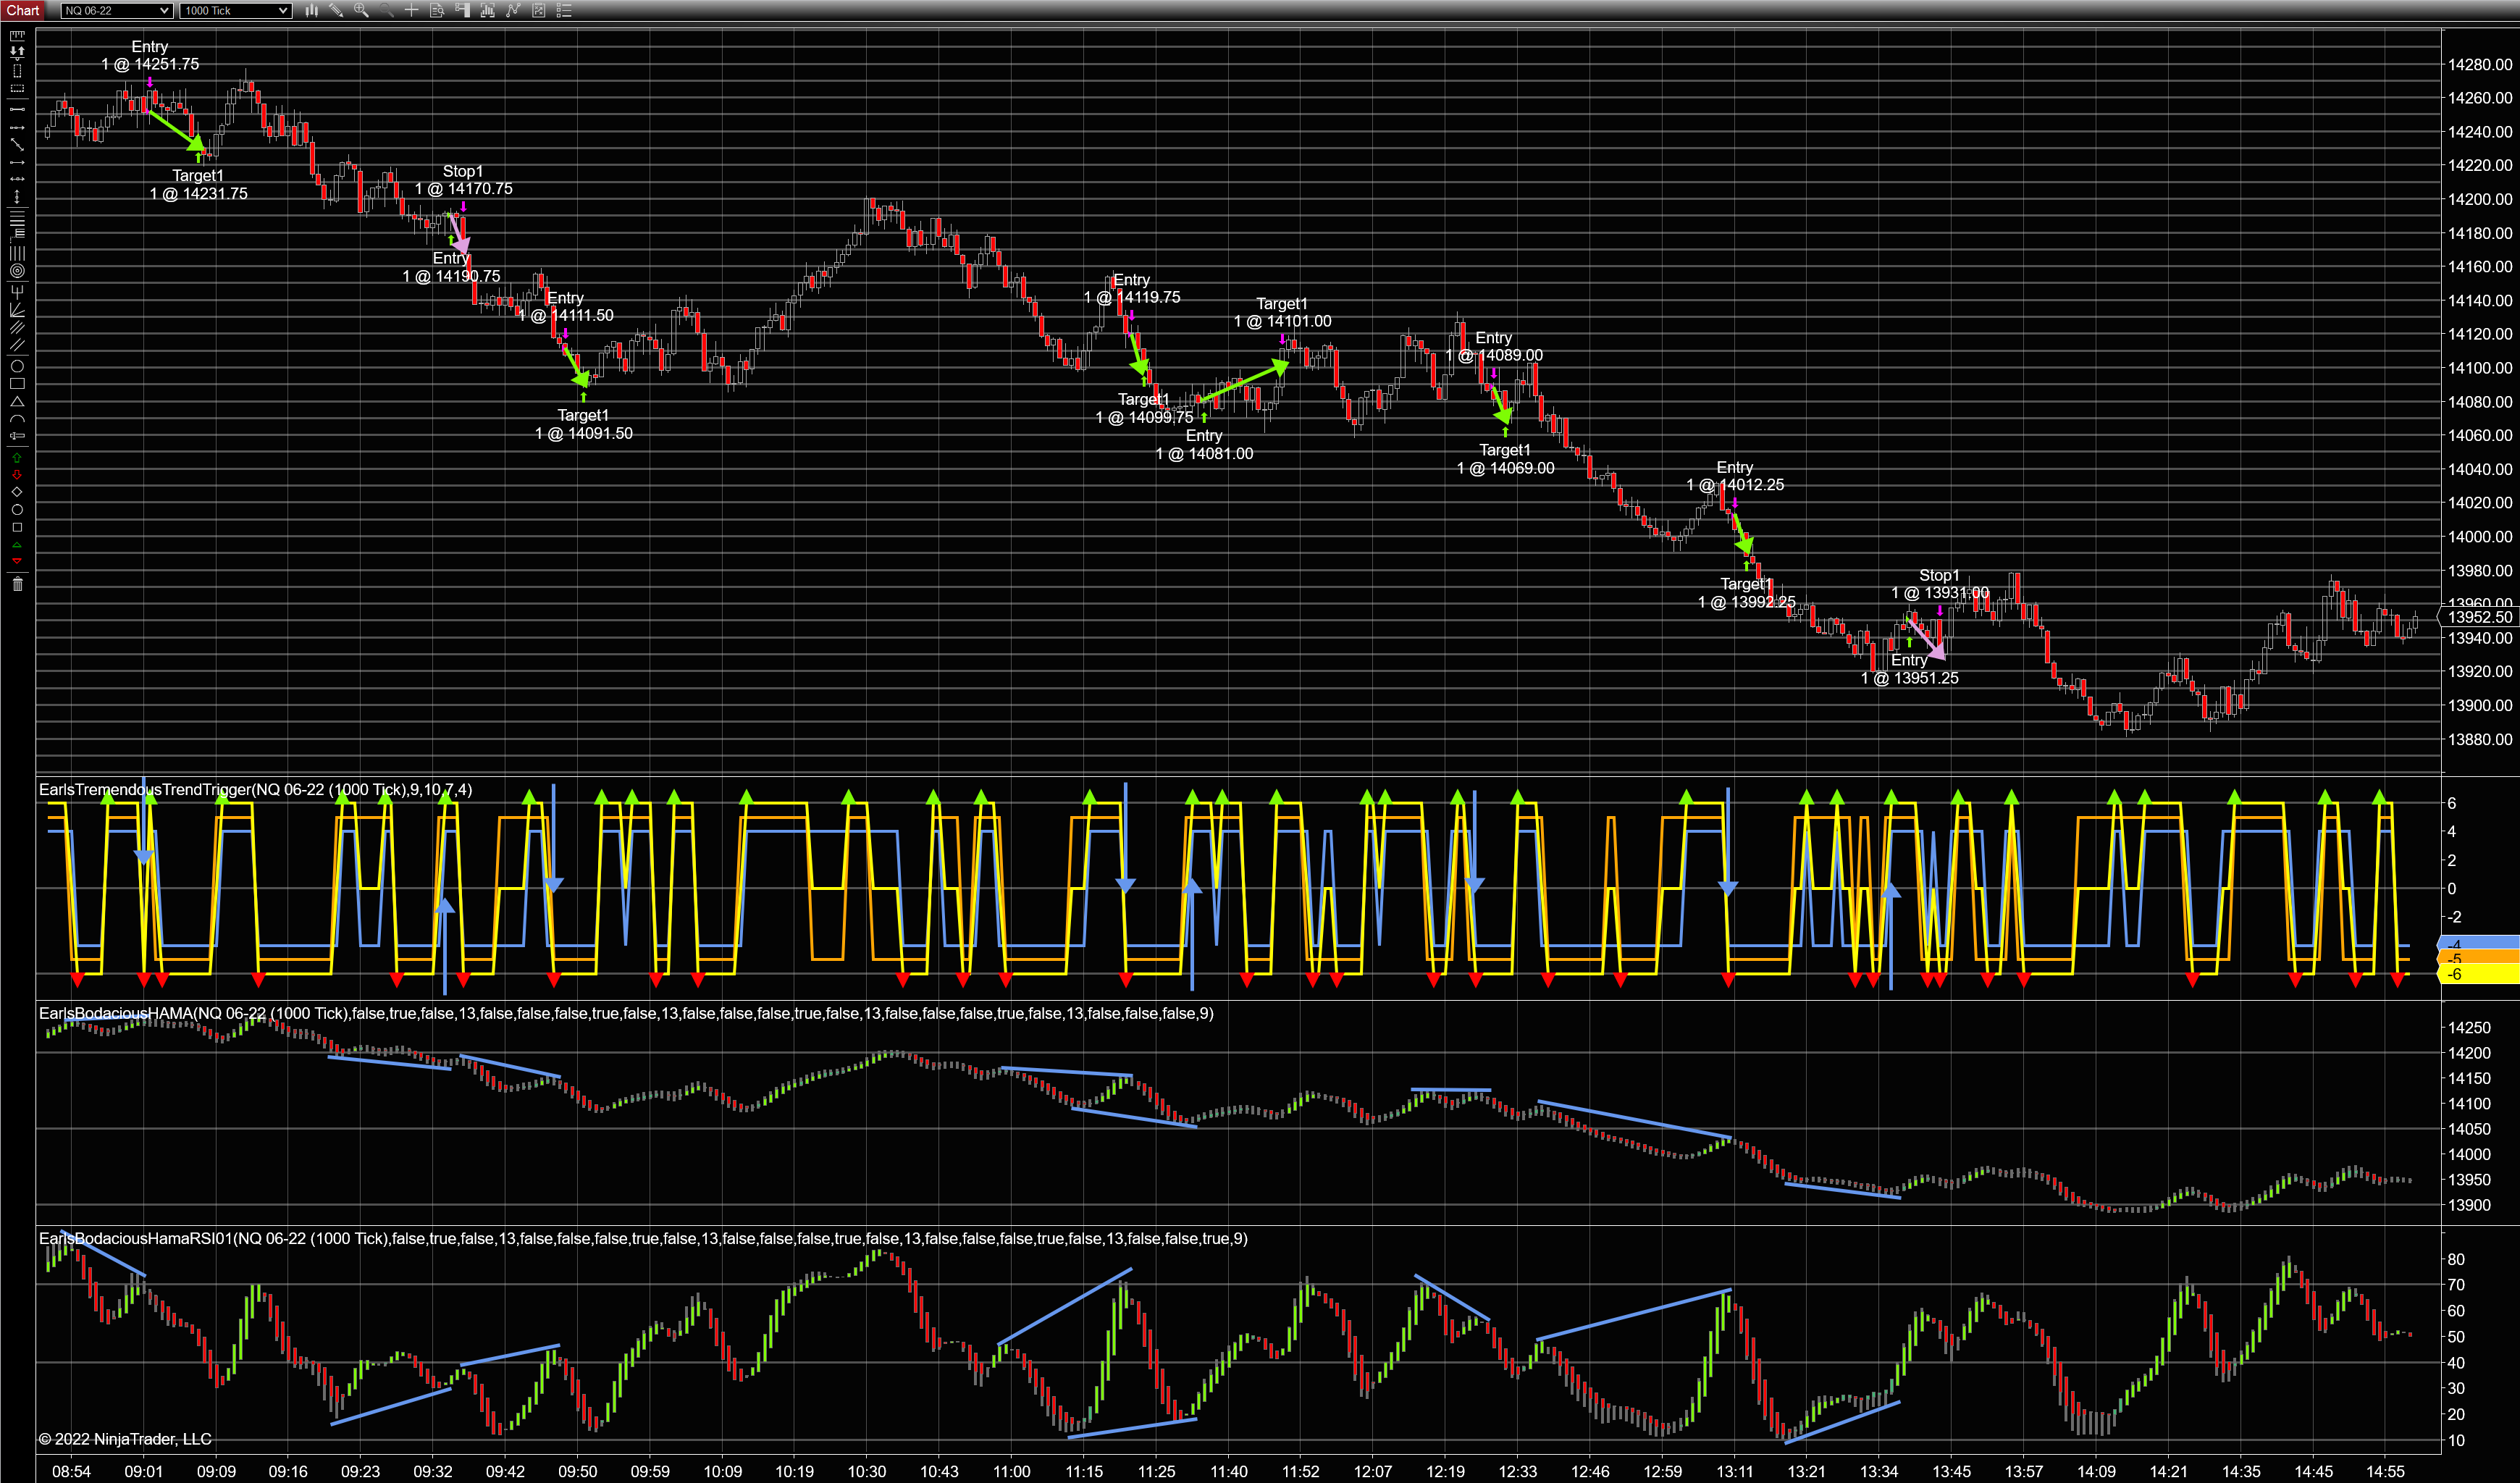
I used two instances of my HAMA indicator to show divergence in the Mini NASDAQ market on a 1000-Tick chart. The top HAMA indicator is based on price. The bottom HAMA indicator is based on RSI. Each horizontal line in the following price charts represents ten points.
I’m also using my Trend Trigger indicator to help with timing. It shows price (blue) and momentum (orange) trends. The yellow line indicates when the two trends (price and momentum) coincide, and the arrows indicate when the two trends initially fall into agreement. it is the arrows that are used to time a trade entry after a RSI/Price divergence is spotted.
Disclaimer: Blue lines and green/pink arrows in all the images were added by hand to clarify trades for the purpose of enhancing communication in this post and are not part of the indicators. Also, all these trades were made in a simulated account as real-time market data was coming in. So slippage might have been a bit different had trades been executed by a broker.
Trade 1: Profit = 20 Points
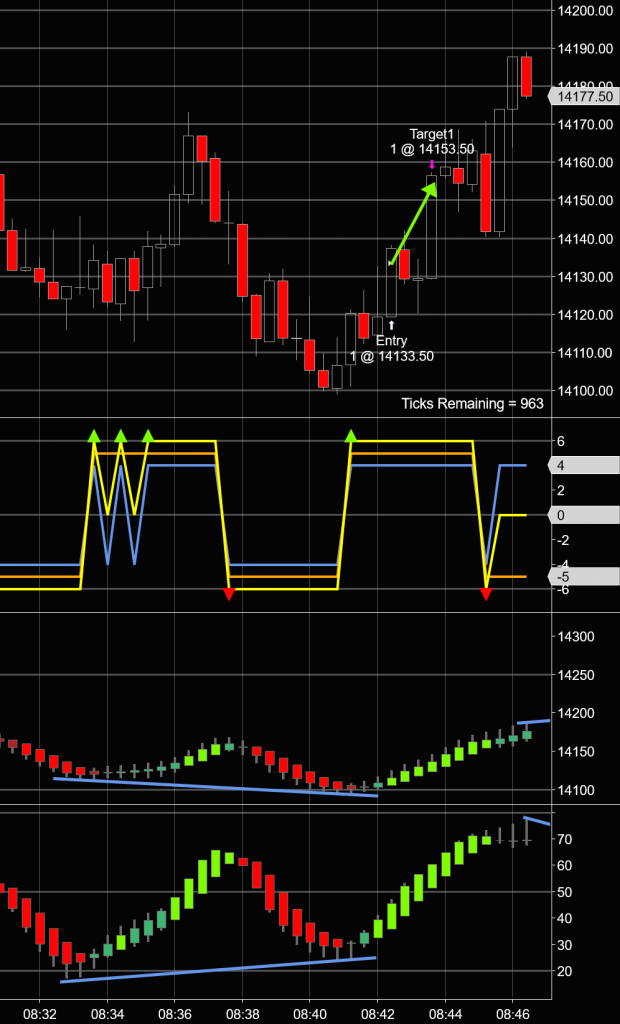
This trade was textbook and did its thing perfectly. I actually got into this one late after it had already moved thirteen points, but it worked out just fine. (I don’t recommend entering trades late like this, though. Chasing the market seldom works out. I just got lucky this morning.)
Trade 2: Profit = 20 Points
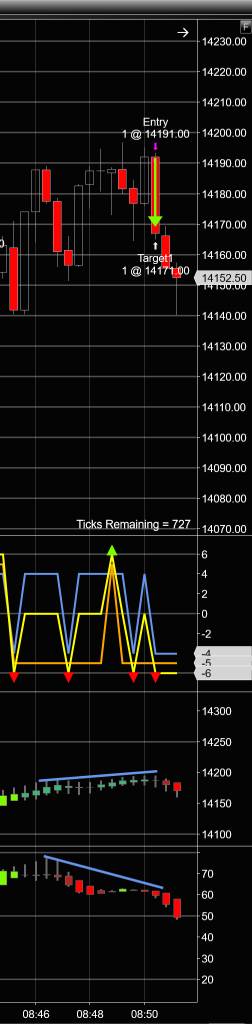
Another textbook trade, executed in just one bar.
Trade 3: Profit = 20 Points
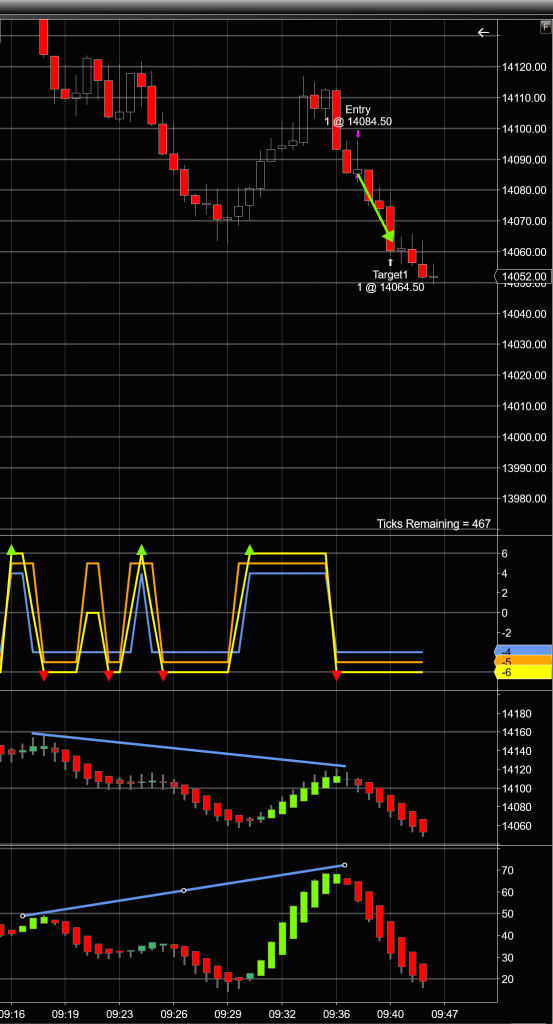
Another textbook trade. I love it when the market cooperates.
Trade 4: Profit = 20 Points
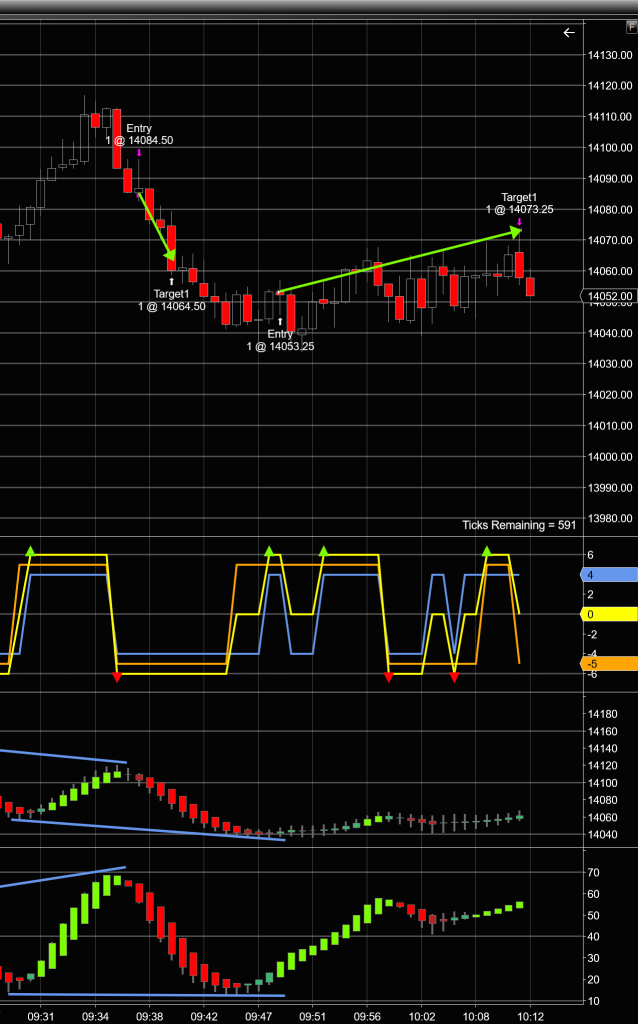
I entered this trade before I had drawn the blue lines showing divergence. Had I known the RSI line was pretty much horizontal (it should be going up, since the price line is going down), I wouldn’t have entered this trade. I don’t advocate drawing lines prior to entering trades since doing so can cause costly delays, but sometimes it’s a close call, and I end up seeing what I want to see.
Sure enough, the market entered a period of consolidation. But it did eventually end up hitting my target and landing me a profit.
Trade 5: Loss = 20 Points
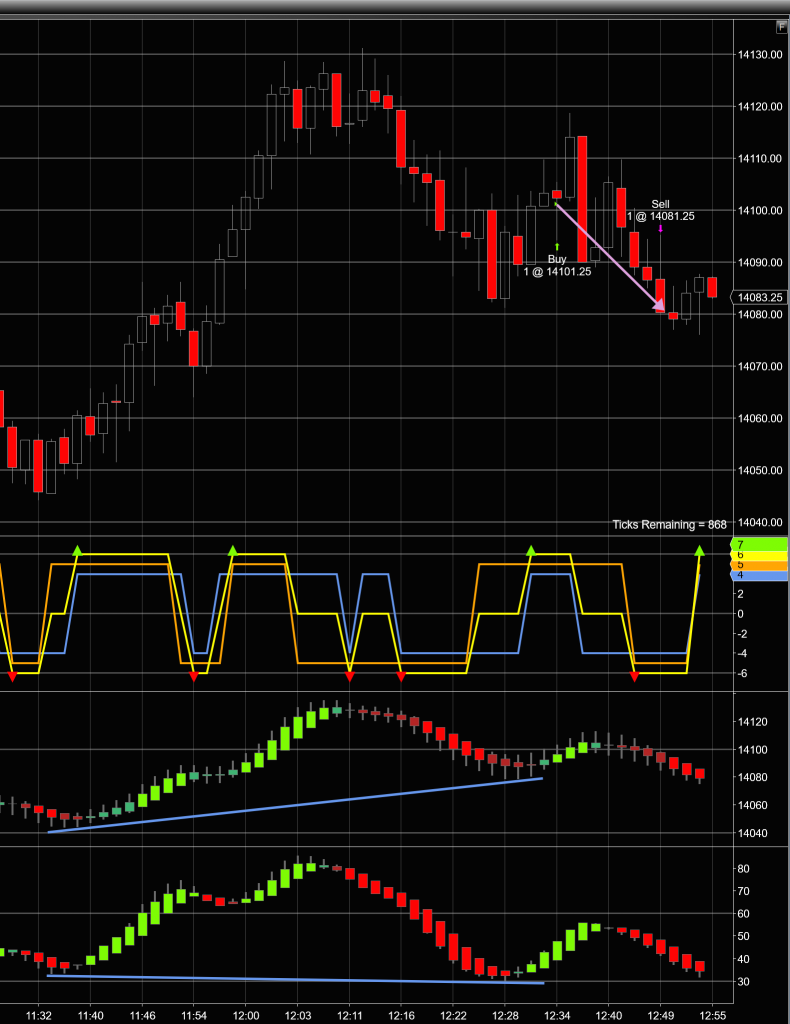
This was my one bad trade of the day. The RSI line (blue line on the bottom) doesn’t tilt down very much, but the price line (blue line in the next panel up) was decidedly tilted up at a respectable slope, so I entered the trade. The price got within 2.25 points of my target, then went down and took out my stop at a 20-point loss.
I normally don’t like to let the price get that close to my profit-target without manually moving my stop-loss up to claim some profit, but I’m doing this to demonstrate my indicator as honestly as I can, so I let it be.
Also, truth be told, I’m known for snatching defeat out of the jaws of victory when I start manually mucking about with my stop-losses and profit-targets. I’m usually better off letting them be anyway.
Daily Statistics
Total Trades: 5
Good Trades: 4
Bad Trades: 1
Net Good Trades: 3
Net Profit: 60 Points in the NQ Mini NASDAQ market
Executions
To document my trade executions, here’s my execution log:
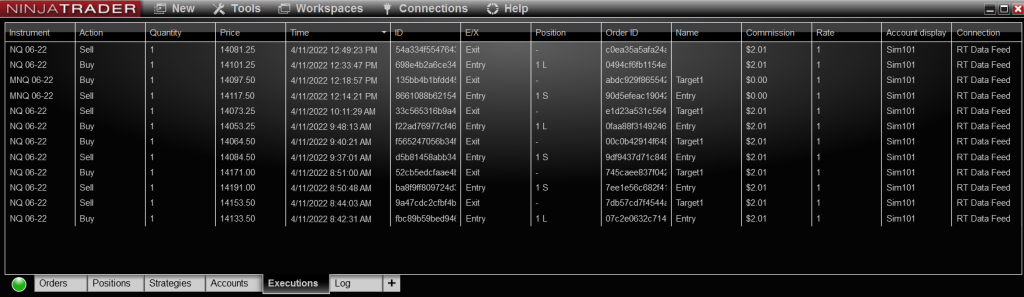
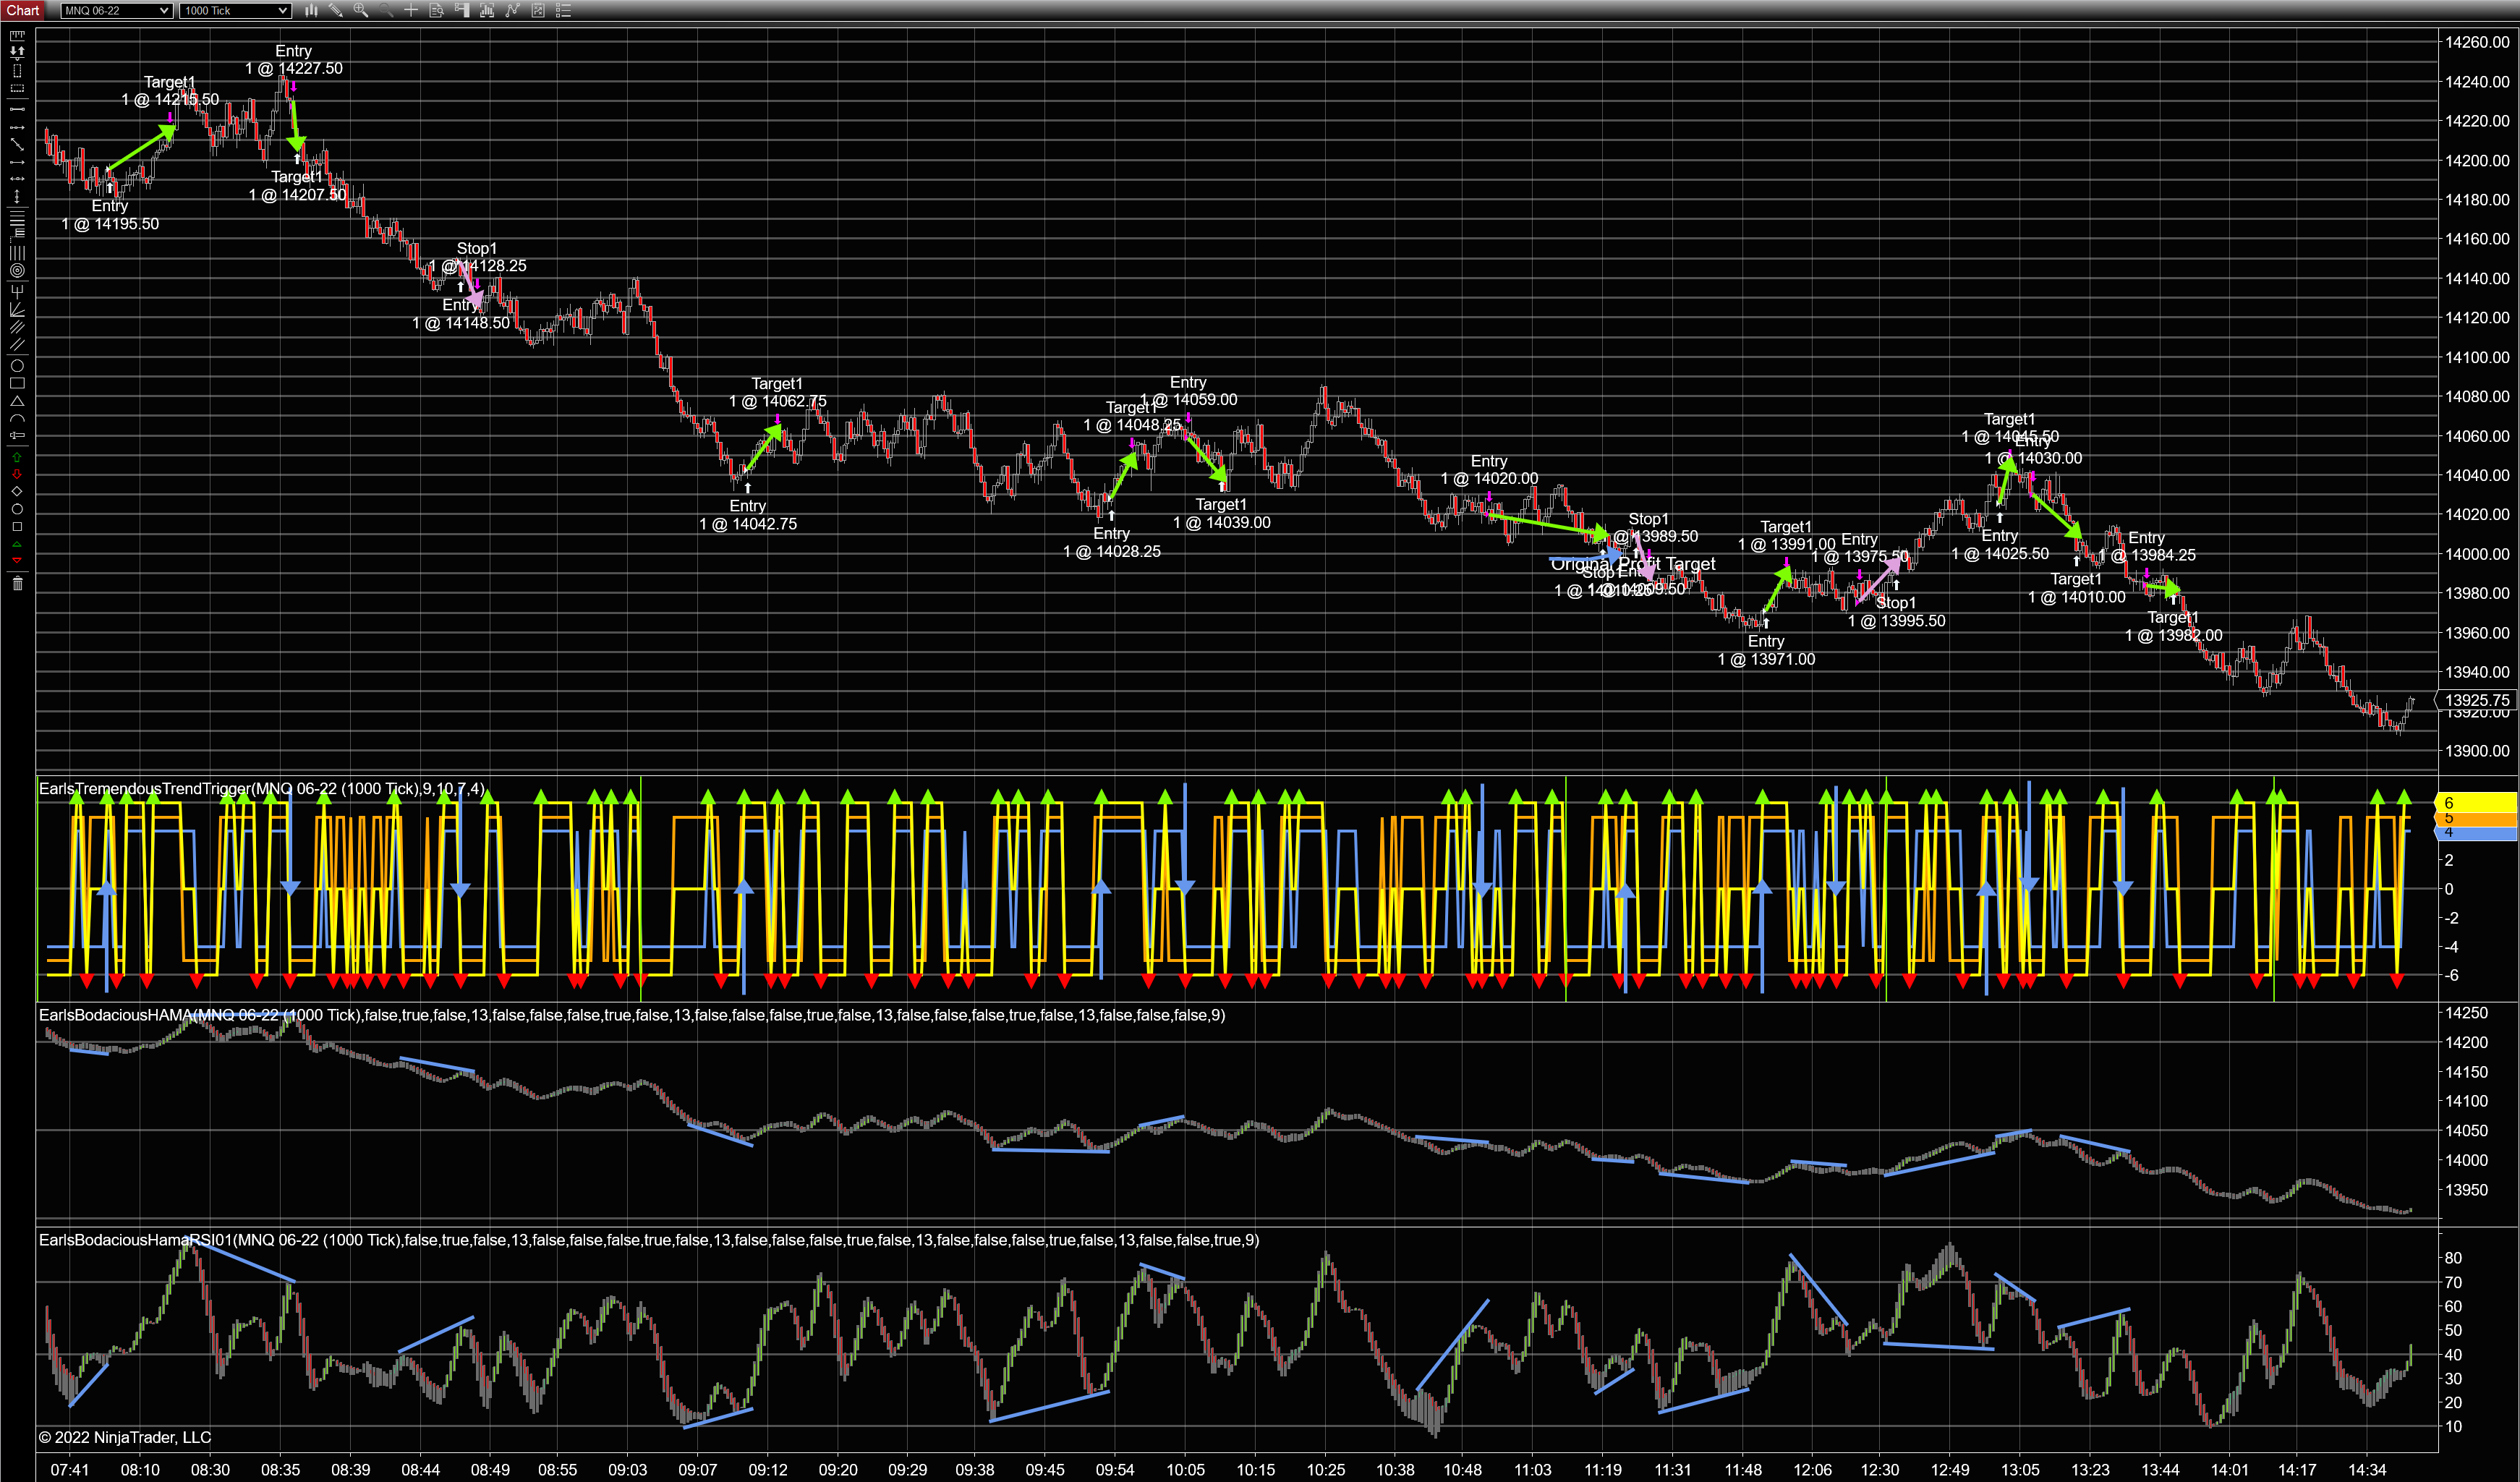
There is one trade in the MNQ (Micro NASDAQ) market that was made extraneously. It was a great (profitable) trade, but since it was made on a whim (given the setup, I couldn’t resist) and not to demonstrate my HAMA indicator in the Mini NASDAQ market, it doesn’t count here. As you can see, four out of the five trades in the NQ market (the ones that do count) made a profit, and those are the trades detailed in this post.
And here is a screen capture of the day’s run, showing my trades in context:
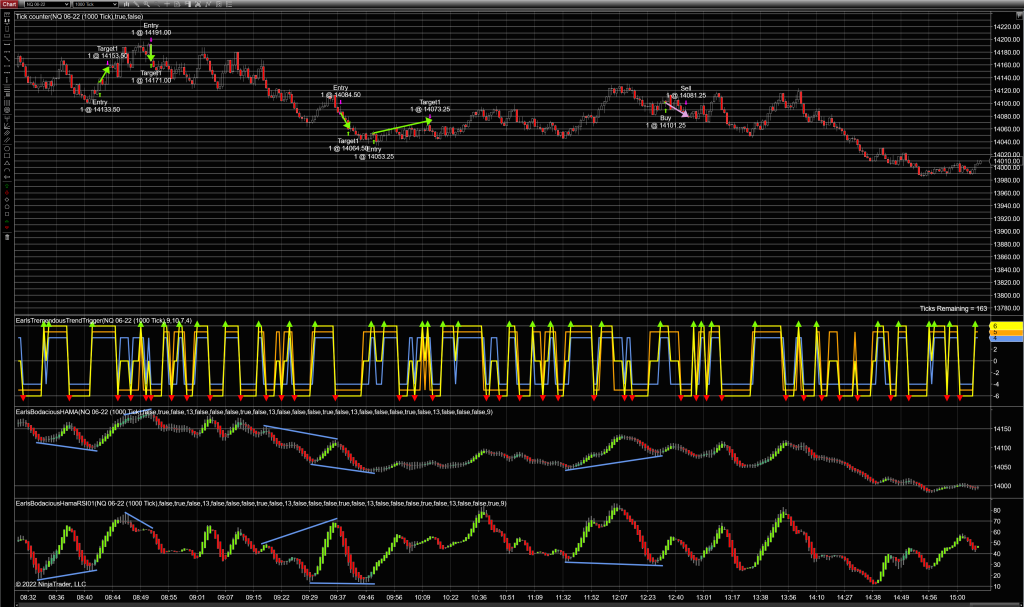
I usually get a few more trades than that per day, but I like a calm market, and I wouldn’t trade today’s results for anything.
If you have any questions or comments, feel free to leave them below. And if you’re interested, click HERE to get my HAMA indicator.
Happy Trading, and always remember: It’s better to make less than you coulda than to lose more than you shoulda.

Thanks for your blog, nice to read. Do not stop.
Thanks for the encouragement, Mark. I appreciate your kind words. I’ve been on the road a lot lately, but I should be getting back into it soon.
Thanks for the post