Using my HAMA/Divergence Indicator in the NASDAQ Market
13 Trades Today: 10 Winners, 3 Losers
I set my ATM to use a 20-point stop-loss and a 20-point profit-target. All my trades were just one-position trades.
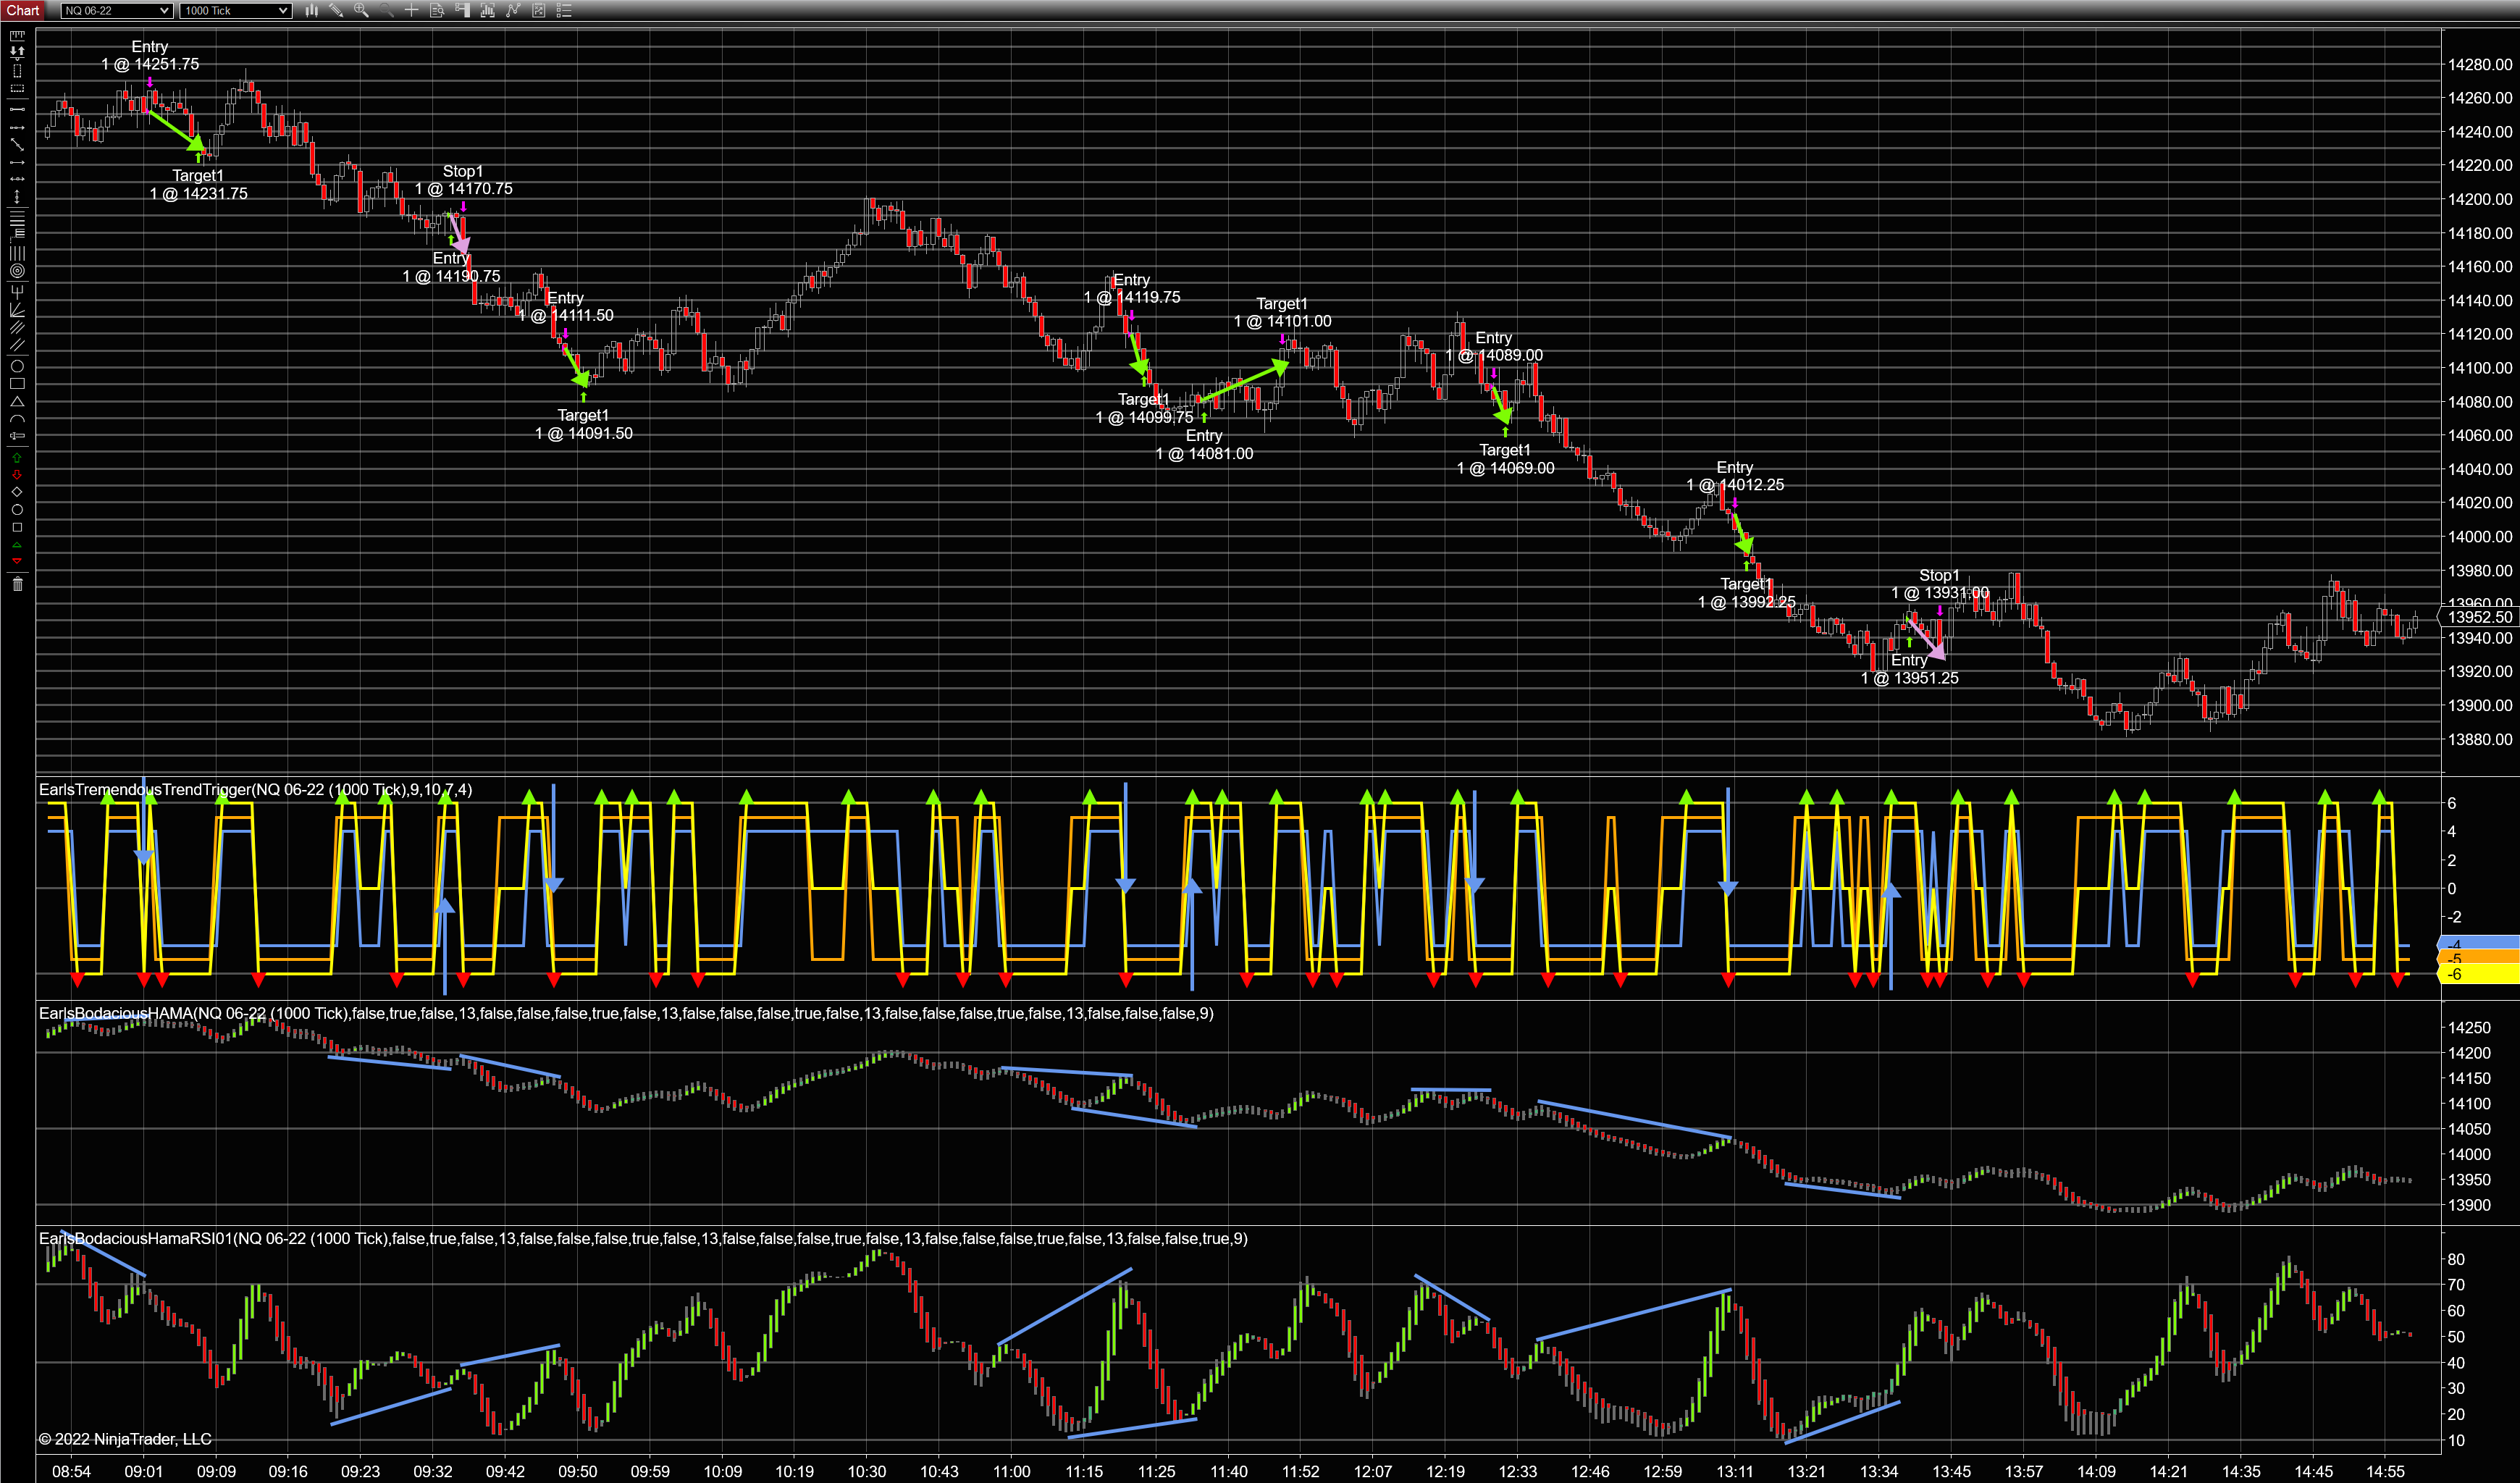
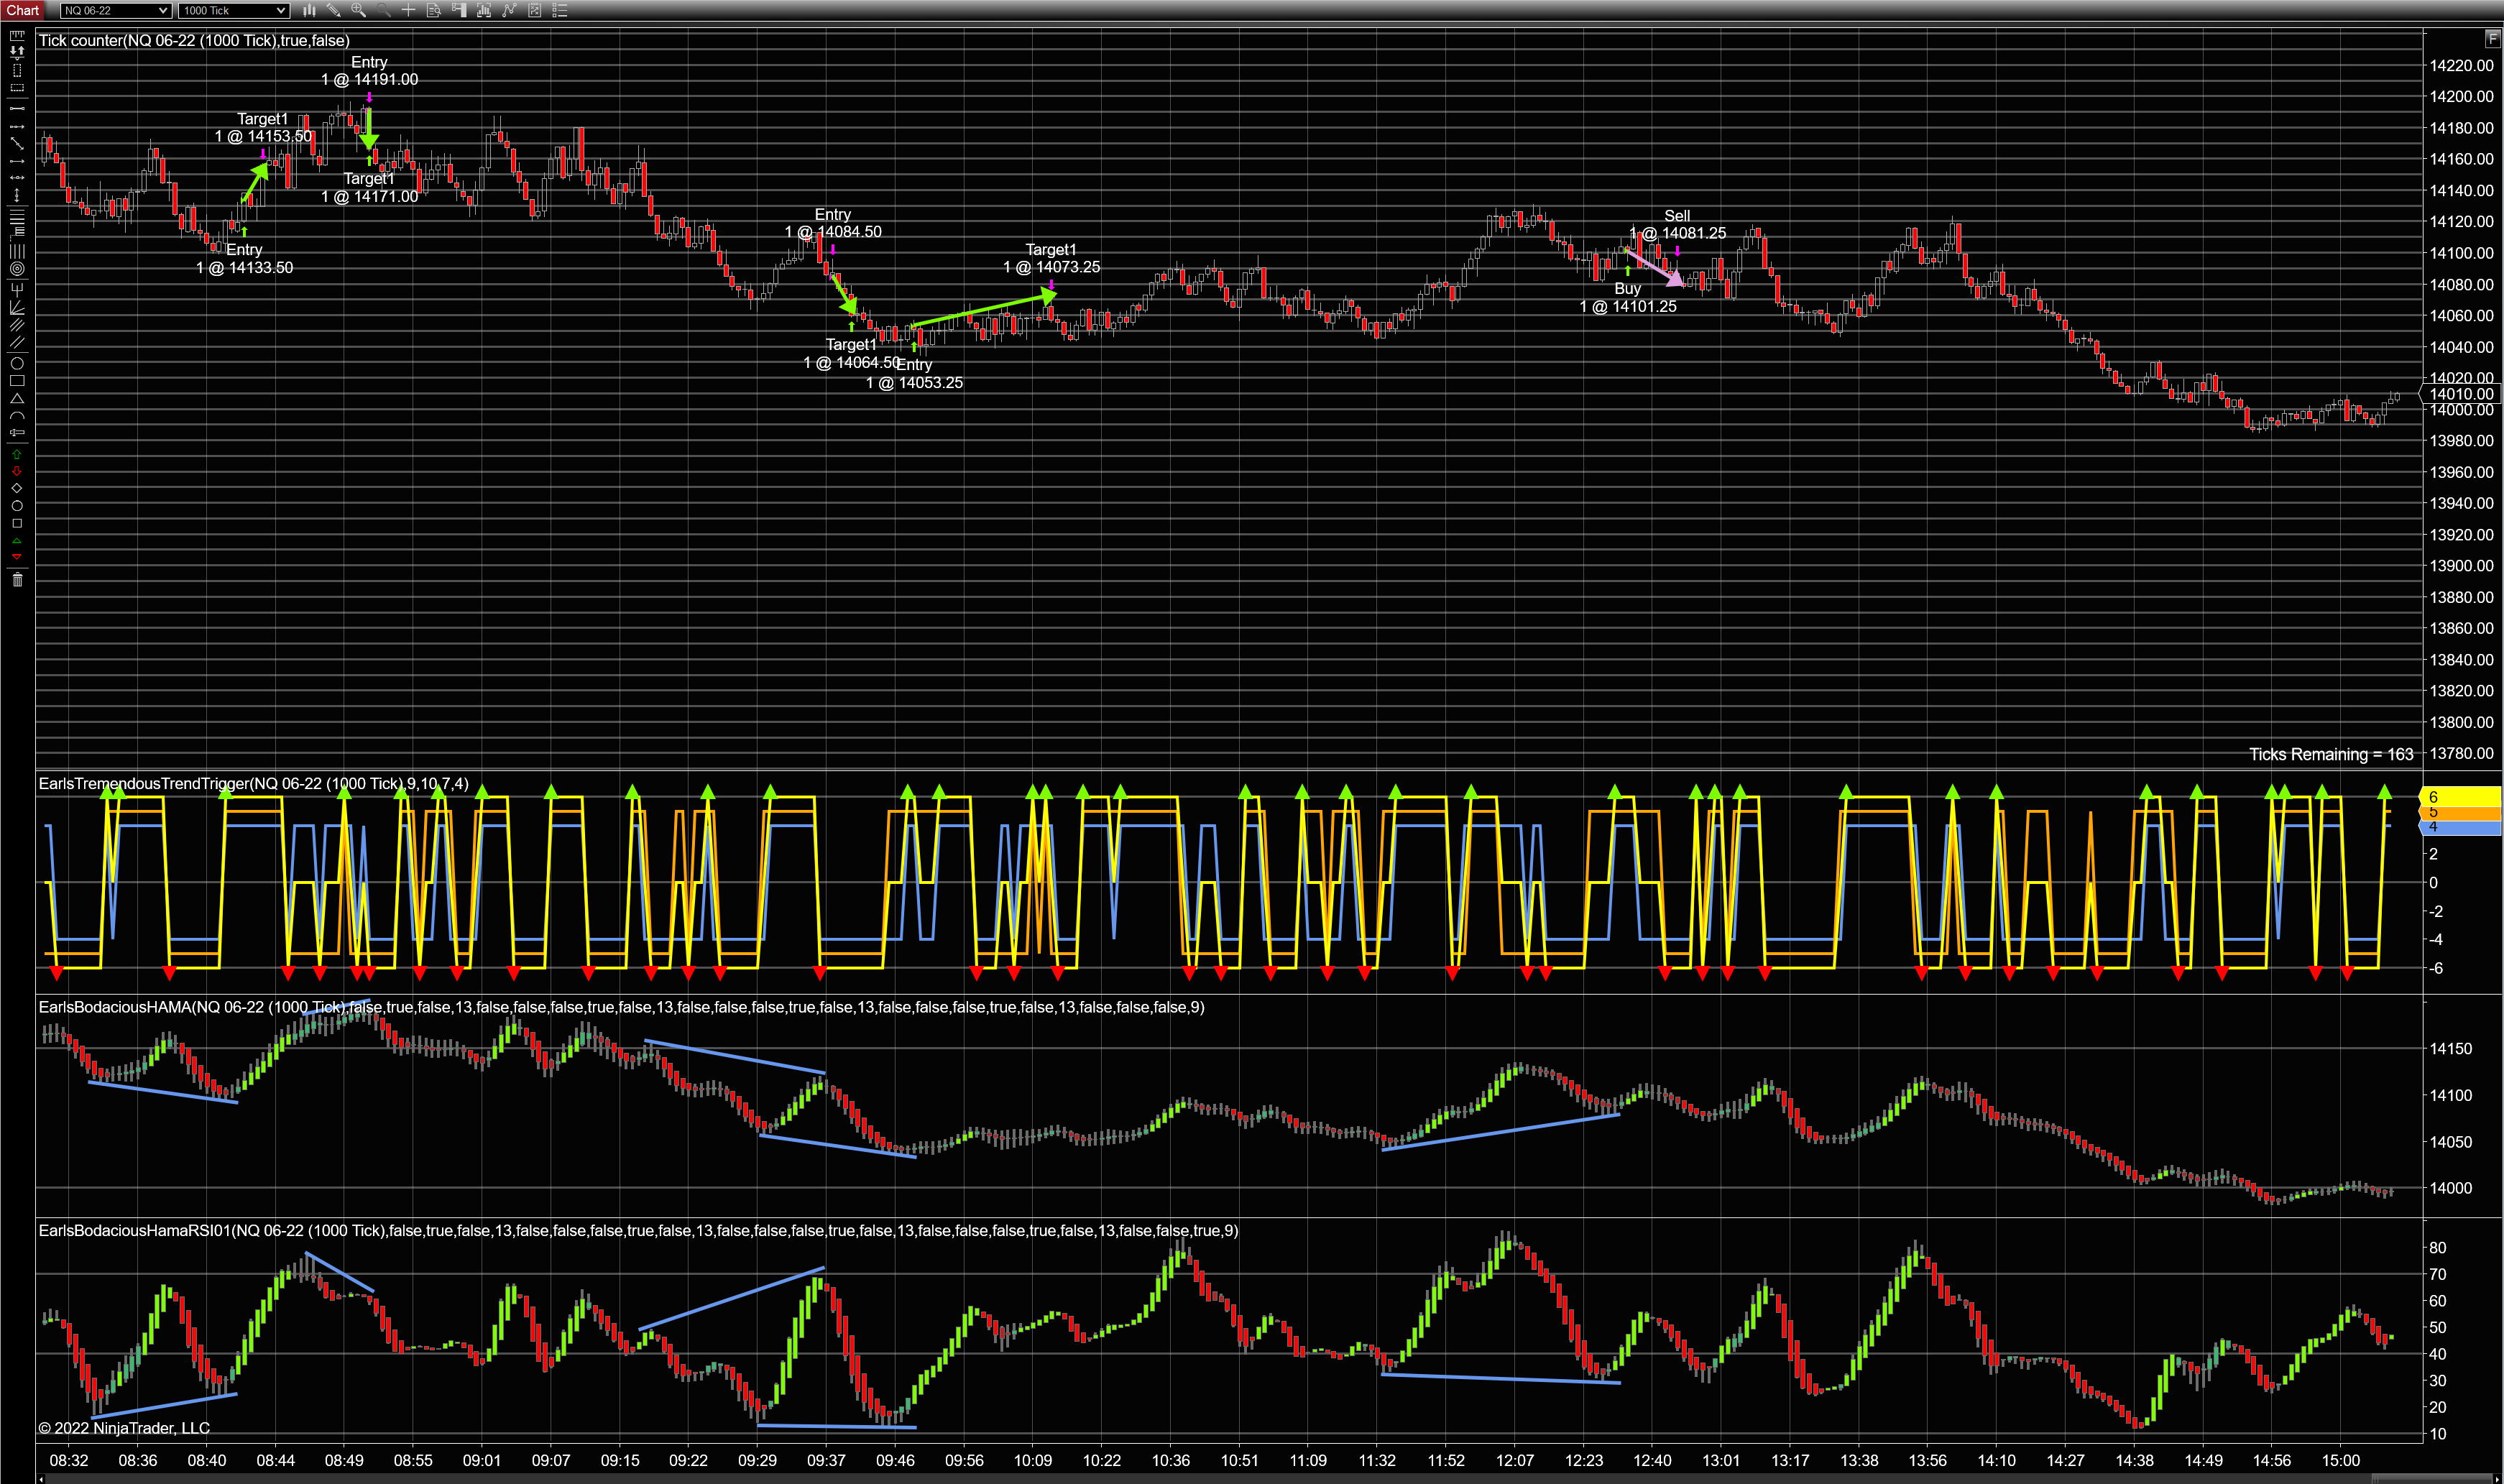
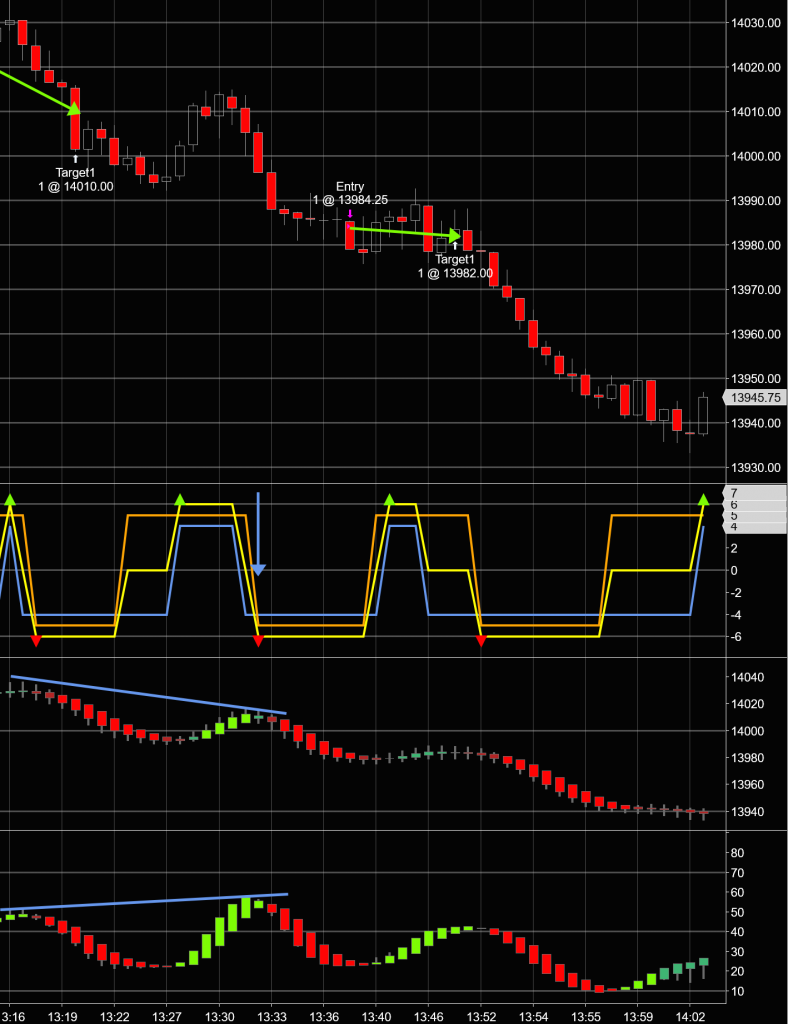
I used two instances of my HAMA/Divergence indicator to show divergence in the Micro-NASDAQ market on a 1000-Tick chart. The top HAMA/Divergence indicator is based on price. The bottom HAMA/Divergence indicator is based on RSI. Each horizontal line in the following price charts represents ten points.
I’m also using my Trend Trigger indicator to help with timing. It shows price (blue) and momentum (orange) trends. The yellow line indicates when the two trends (price and momentum) coincide, and the arrows indicate when the two trends initially fall into agreement. The arrows are used to time a trade entry after RSI/Price divergence is spotted.
Technique Used: When price-HAMA and RSI-HAMA diverge at the peaks, it’s considered a bearish divergence. When price-HAMA and RSI-HAMA diverge at the valleys, it’s considered a bullish divergence. Once a divergence is spotted, I then wait for an arrow to appear in my Trend Trigger indicator (up for bullish divergence, down for bearish divergence). When I get the appropriate arrow following a divergence, I enter a trade (long for bullish, short for bearish).
Disclaimer: Blue trend lines/arrows and green/pink arrows in all the images were added by hand to clarify trades for the purpose of enhancing communication in this post and are not part of the indicators.
All these trades were made with REAL MONEY in the Micro NASDAQ (MNQ) market, so this is as real as it gets.
There were a few trades I missed because of meal-time and bathroom breaks. I’ll leave it up to you to spot those and see if they would have helped or hurt my bottom line.
Embarassingly, there were also three trades where I just goobered up and took less profit (or a loss, in one case) than I otherwise could have. I include these because I want you to trust that I’ll always be honest with you, and to let you know that if you do stupid stuff while trading, you’re not alone.
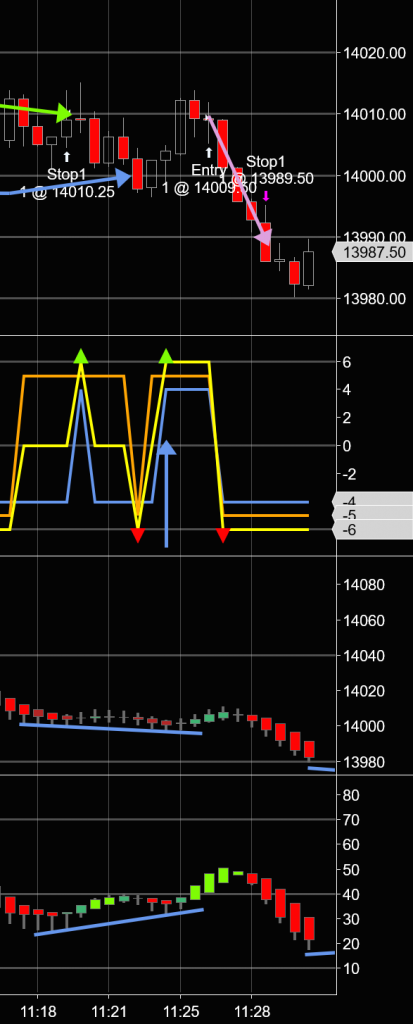
Trade 1: Profit = 20 Points
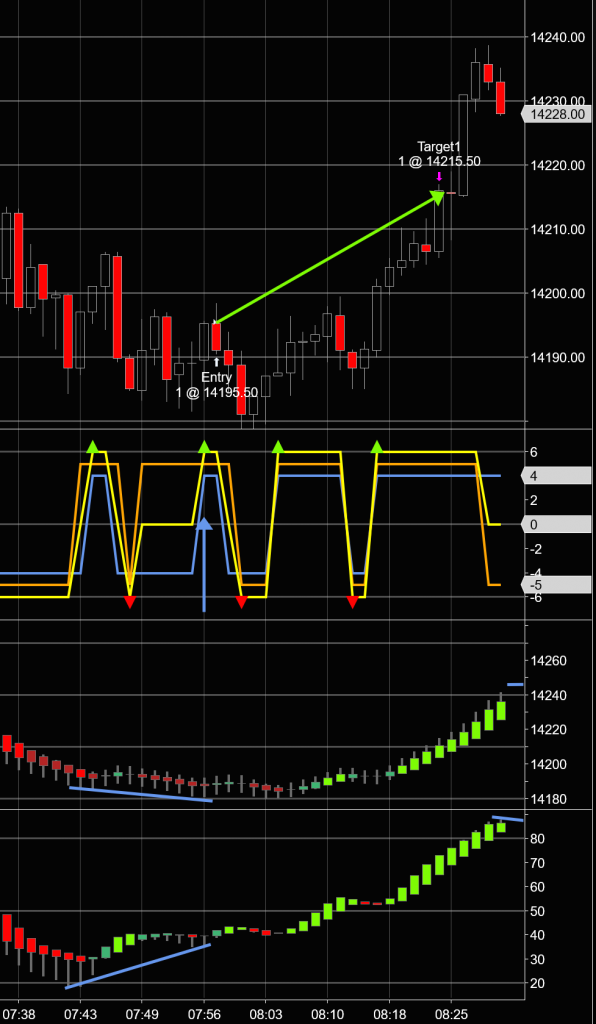
Though this was a pre-market trade, the setup was so perfect that I couldn’t resist taking it. Glad I did.
Trade 2: Profit = 20 Points
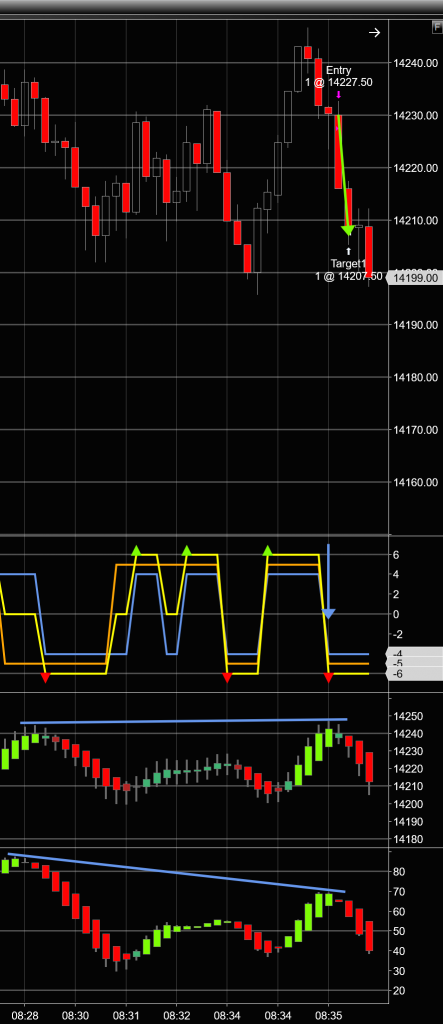
It’s more important for the RSI trend line (blue line in bottom panel) to have a nice slope to it than it is for the price trend line (blue line in middle panel) to have a slope to it. Even so, the divergence is there, so I went for it and got another 20 points.
Trade 3: Loss = 20.25 Points
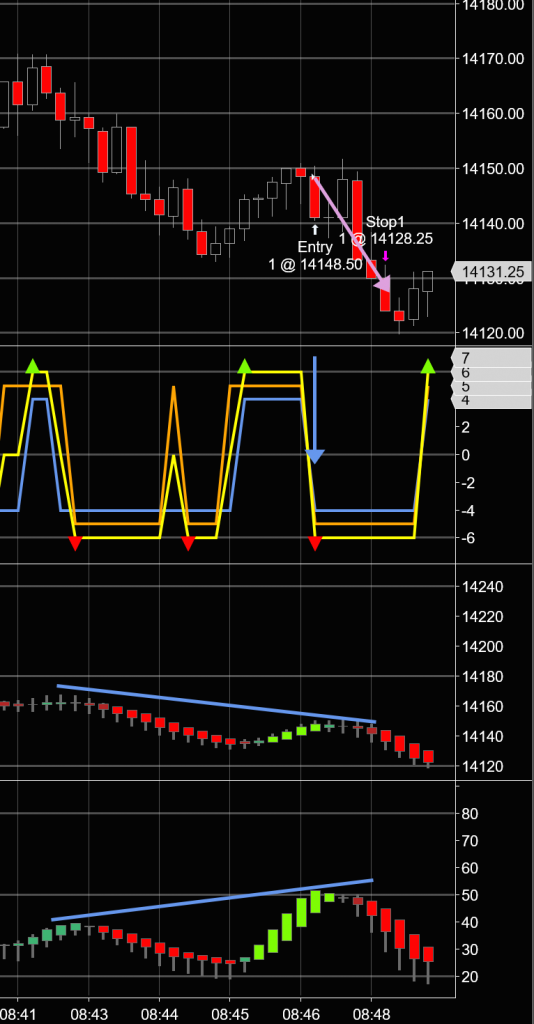
Okay, so this is an example of me being stupid. I got a bearish divergence (diverging peaks is always bearish with my HAMA/Divergence indicator), and I got the bearish price/momentum trend arrow as confirmation, AND I WENT LONG INSTEAD OF SHORT!
So I’m just a big dummy.
I took the full 20-point loss and didn’t even realize I had gone the wrong way with my trade until I started drawing trend lines and arrows on the chart for this blog post.
EVEN SO, I’m glad to have confirmed that my indicators provided a righteous entry signal for what should have been a killer trade.
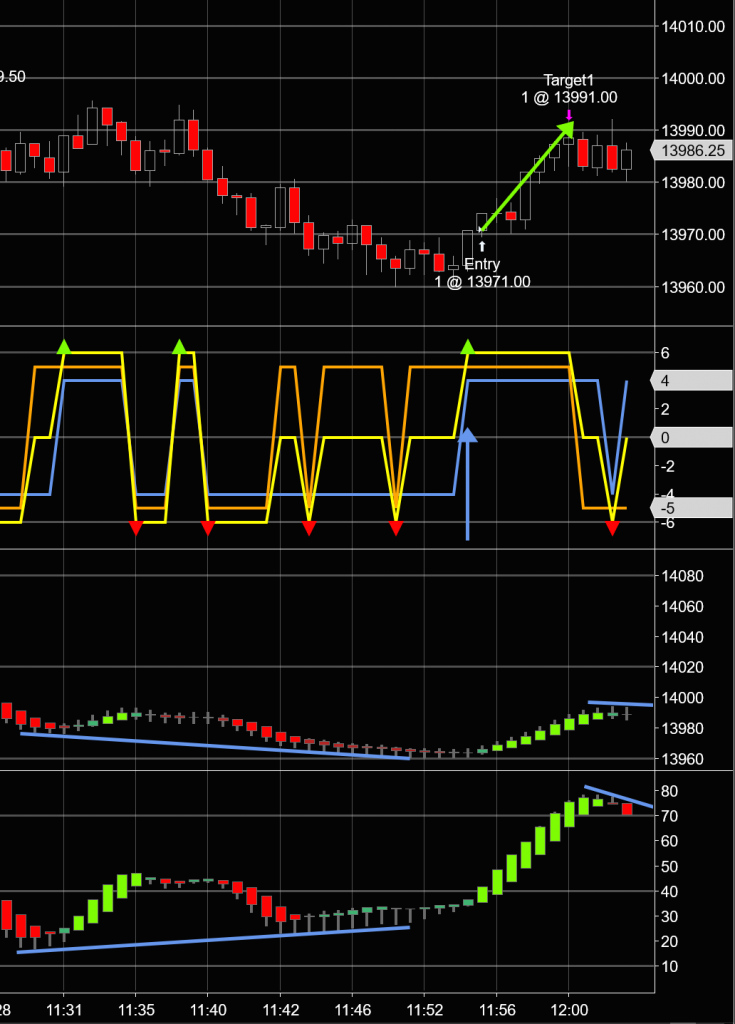
Trade 4: Profit = 20 Points
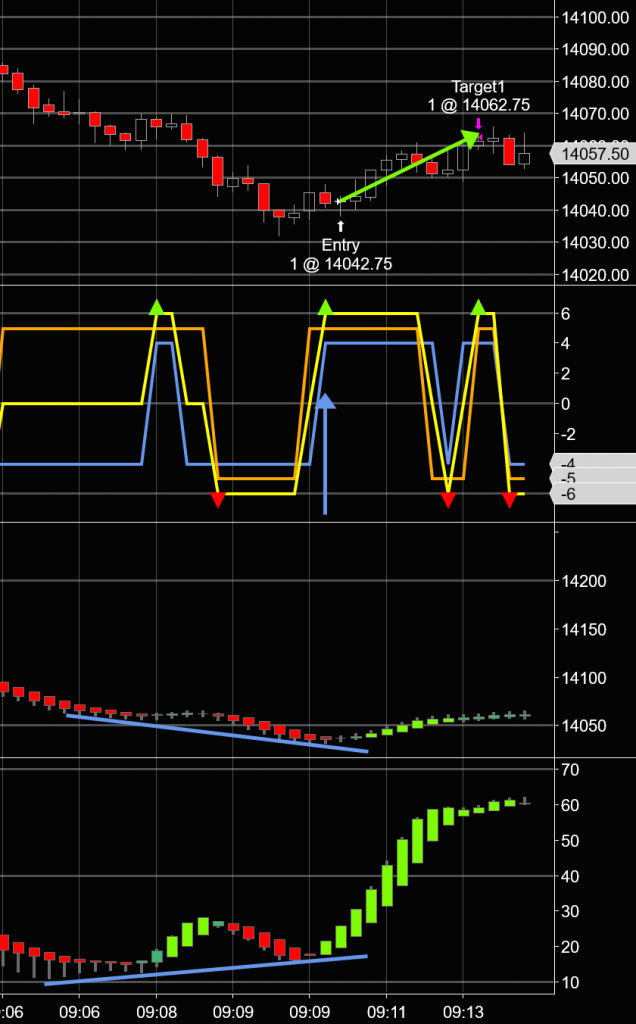
This trade was totally by the book and turned out great. And look, I went the right way this time!
Trade 5: Profit = 20 Points
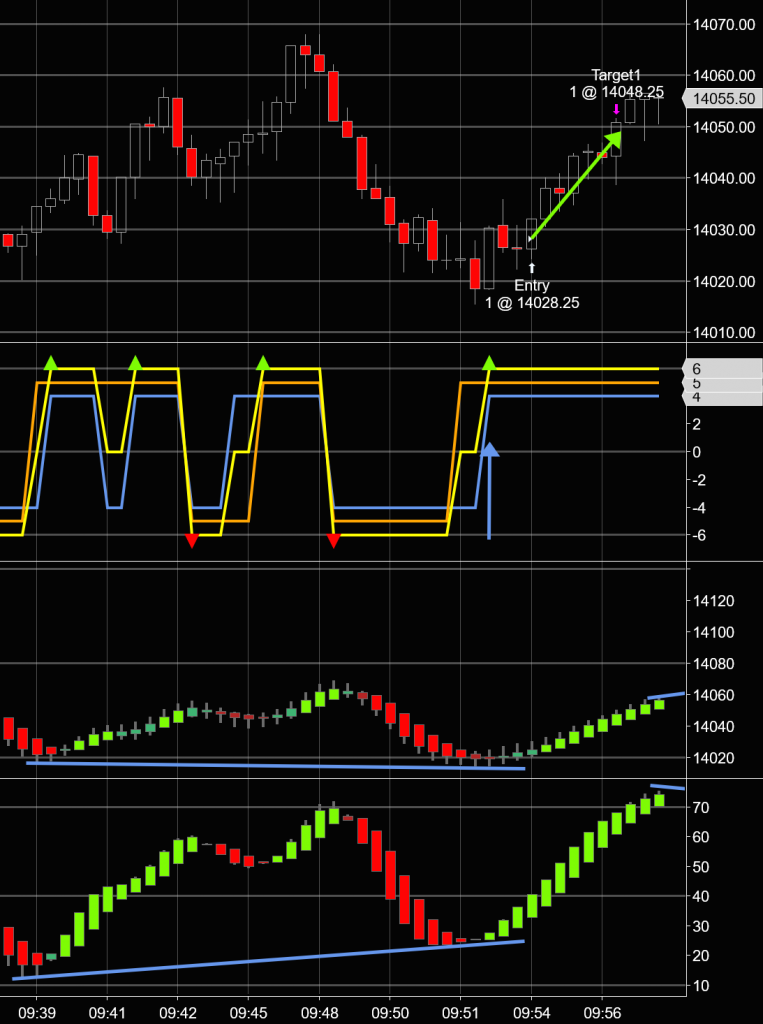
The setup on this one took a while (about 30 bars), but it worked out great.
Trade 6: Profit = 20 Points
Another by-the-book trade. I love it when they work out like this.
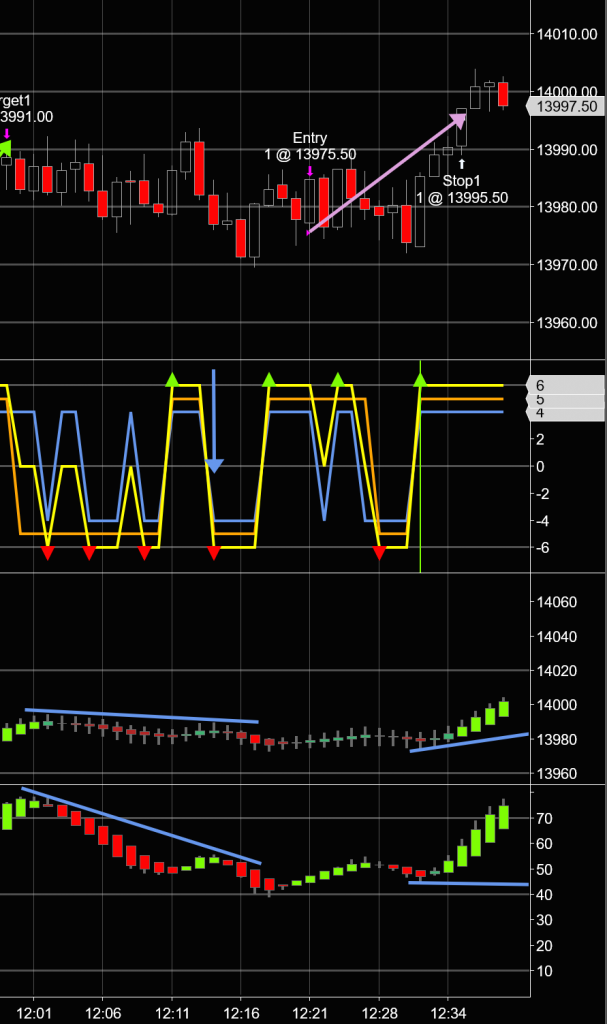
Trade 7: Profit = 9.75 Points
Aaaaand here’s another one I messed up, but not by going the completely wrong way. I chickened out on this one and got out early. After I entered the trade, the market went into a long-wavelength range-trading pattern that often has the effect of nullifying one’s trade theory–effectively giving the market short-term amnesia. So I got out at half my intended profit and called it done. Of course, wouldn’t you know it, price continued down and would have given me the entire 20 points if I had just waited a bit longer.
No regrets, though. Coming out of these range-trading/consolidation periods can be pretty unpredictable at times.
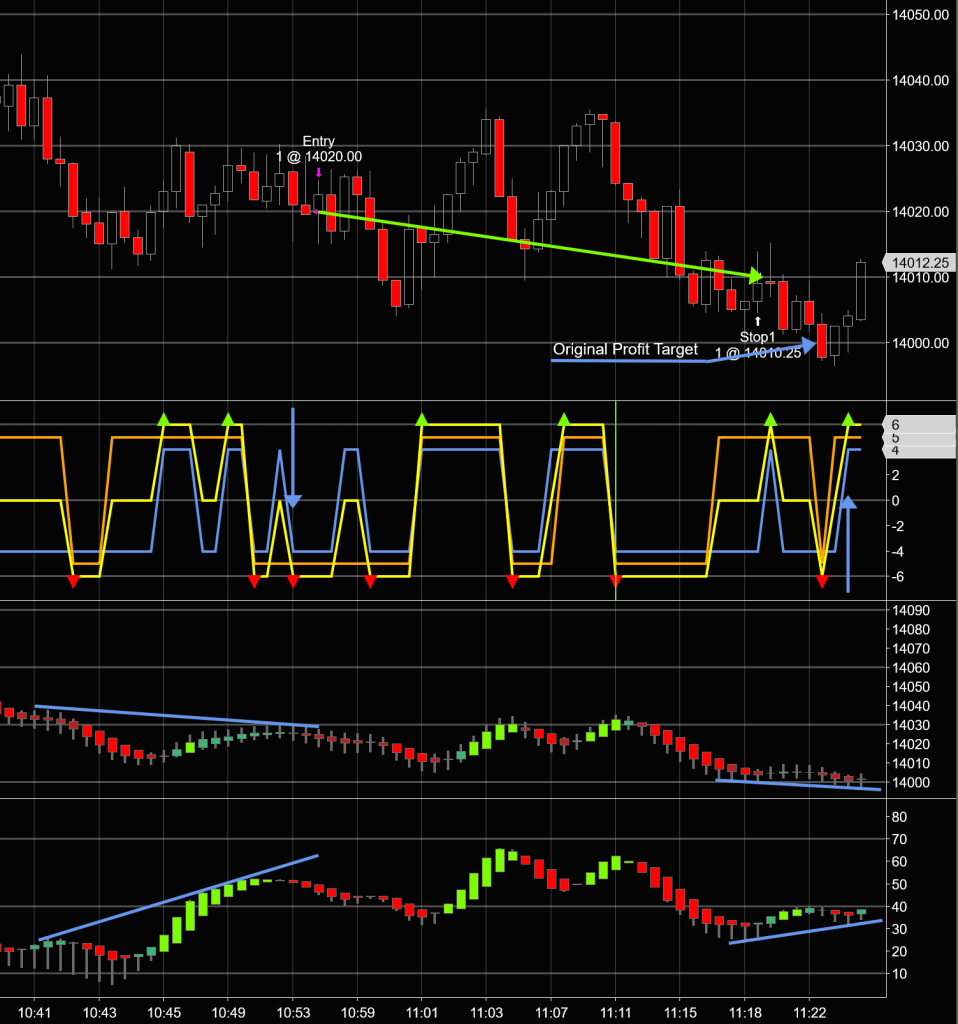
Trade 8: Loss = 20 Points
And this is an example of things just not working out. The entry setup was about as good as it gets. Oh, well. No strategy works every time, as you well know. But I do think it’s pretty sweet that my indicators didn’t lead me astray until the eighth trade of the day. (Remember, Trade Number 3 was a loser because of my own stupidity.)
Trade 9: Profit = 20 Points
This one was fun to watch. No pull-backs to frazzle my nerves–just a straight march toward profit.
Trade 10: Loss = 20 Points
This amounts to a trade I shouldn’t have taken. Sometimes, in my haste, I enter a trade before drawing my divergence lines, and only after I’ve hit my stop-loss do I realize that there was no real divergence in the first place.
Drat.
Trade 11: Profit = 20 Points
The RSI trend slope was barely there, but the price slope was so pronounced that I dared to enter this trade. I’m not sure if I’d do that every time, but it worked out this time.
Trade 12: Profit = 20 Points
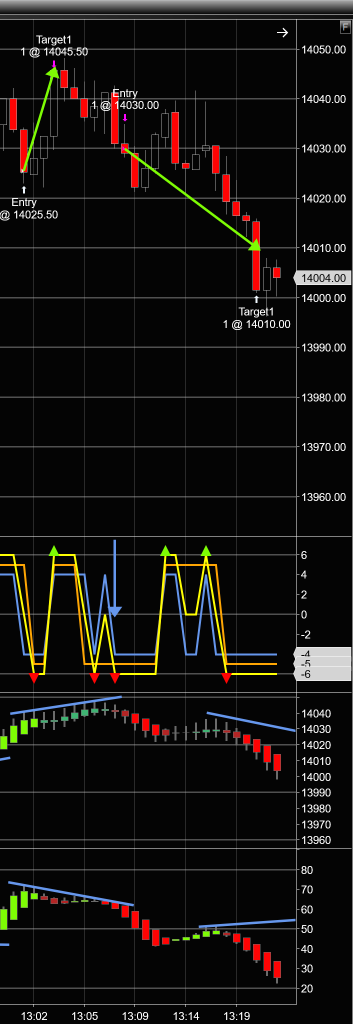
By the book, with a little bit of a pull-back just to keep me on my toes. This was a fun trade.
Trade 13: Profit = 2.25 Points
Again, I was afraid I had entered a trade just as the market entered a (this time) stochastic (the worst kind) consolidation period. So I got out early. Then the market plunged, and would have hit my profit-target without any problem.
If you have ever snatched defeat (or minuscule profit) from the jaws of victory, rest assured: You are not alone.
Daily Statistics
Total Trades: 13
Good Trades: 10
Bad Trades: 3
Net Good Trades: 7
Net Profit: 111.75 Points in the MNQ Micro NASDAQ market
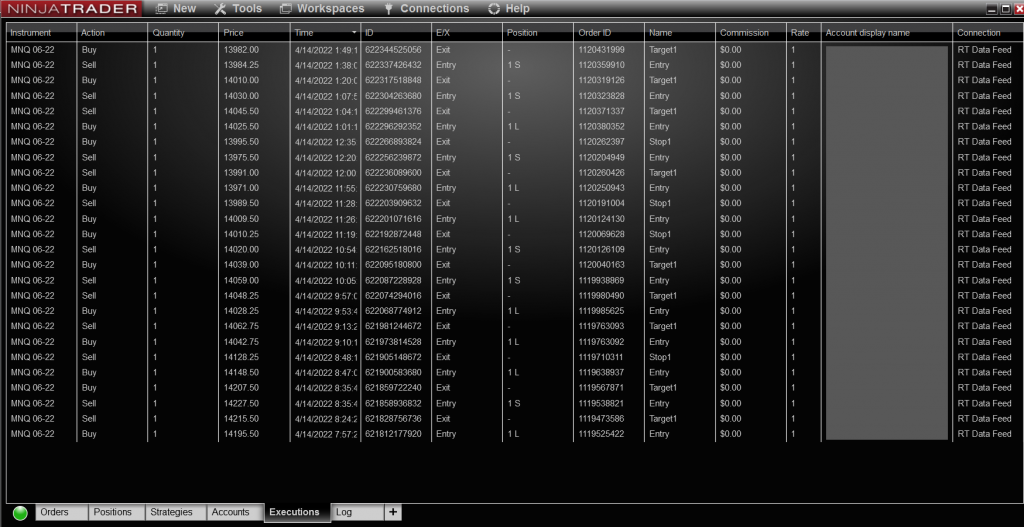
Executions
So you know I’m not hiding bad trades or making up good trades, here’s my execution log:
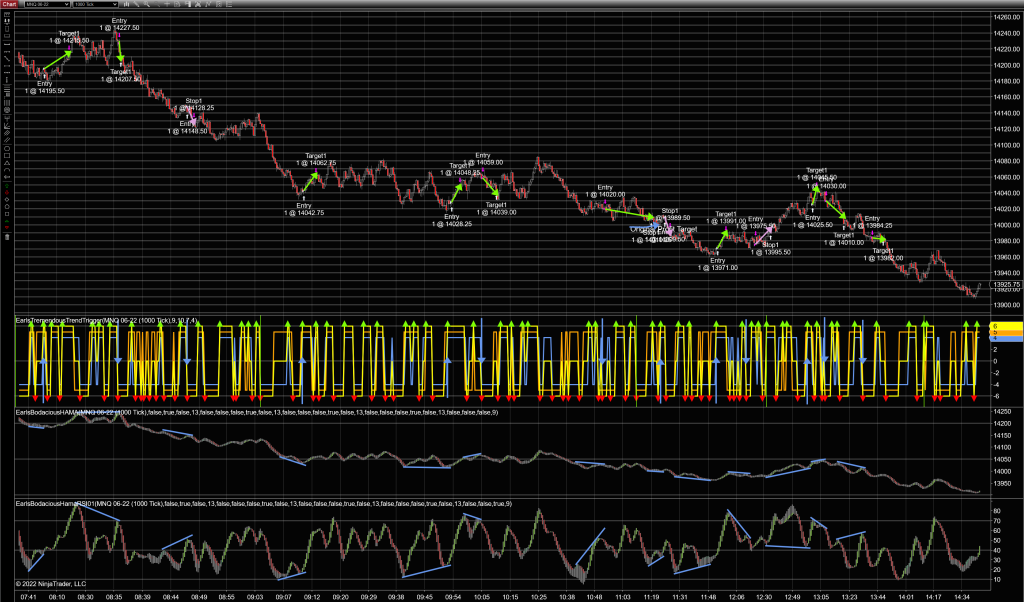
And here is a screen capture of the day’s run, showing all my trades in context:
Even with my screw-ups, I’m pretty happy with the results. I can’t complain when I profit more than 100 points in a day.
If you have any questions or comments, feel free to leave them below. And if you’re interested, click HERE to get my HAMA/Divergence indicator.
Happy Trading, and always remember: It’s better to make less than you coulda than to lose more than you shoulda.