Using my HAMA/Divergence Indicator in the NASDAQ Market
8 Trades Today: 6 Winners, 2 Losers
After evaluating premarket volatility, I set my ATM to use a 20-point stop-loss and a 20-point profit-target. (This is becoming my new normal.) And all my trades were just one-position trades.
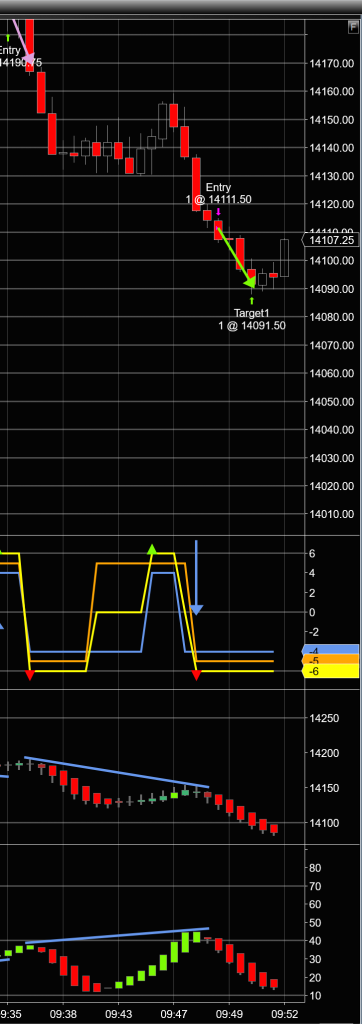
I used two instances of my HAMA indicator to show divergence in the Mini NASDAQ market on a 1000-Tick chart. The top HAMA indicator is based on price. The bottom HAMA indicator is based on RSI. Each horizontal line in the following price charts represents ten points.
I’m also using my Trend Trigger indicator to help with timing. It shows price (blue) and momentum (orange) trends. The yellow line indicates when the two trends (price and momentum) coincide, and the arrows indicate when the two trends initially fall into agreement. it is the arrows that are used to time a trade entry after a RSI/Price divergence is spotted.
Technique Used: When price-HAMA and RSI-HAMA diverge at the peaks, it’s considered a bearish divergence. When price-HAMA and RSI-HAMA diverge at the valleys, it’s considered a bullish divergence. Once a divergence is spotted, I then wait for an arrow to appear in my Trend Trigger indicator (up for bullish divergence, down for bearish divergence). When I get the appropriate arrow following a divergence, I enter a trade (long for bullish, short for bearish).
Disclaimer: Blue trend lines/arrows and green/pink arrows in all the images were added by hand to clarify trades for the purpose of enhancing communication in this post and are not part of the indicators. Also, all these trades were made in a simulated account as real-time market data was coming in. So slippage might have been a bit different had trades been executed by a broker.
Also, since I was struggling with a plumbing issue at the house today, I couldn’t watch the market the entire time, so there are some trades I totally missed. I’ll leave it as a homework assignment for you to find the trades I missed and to determine if they would have increased or decreased my profit.
Trade 1: Profit = 20 Points
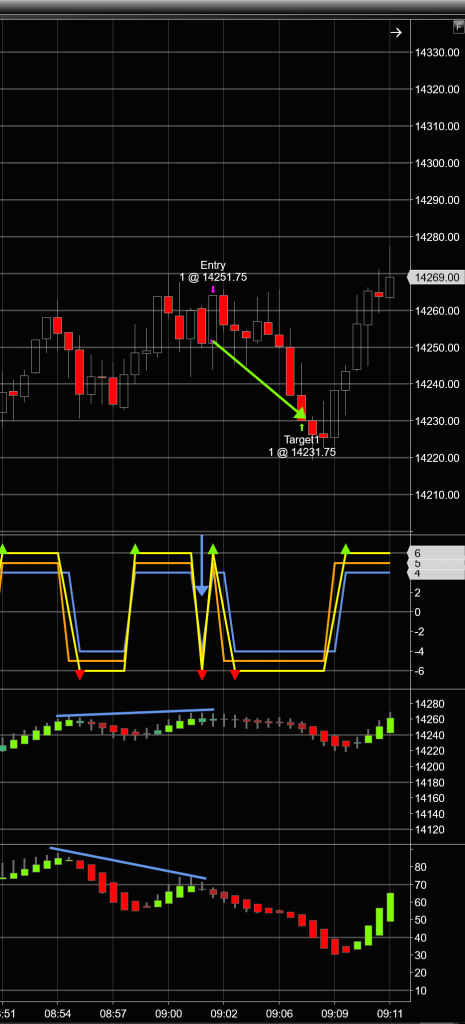
By the book, and pretty much as good as it gets. Divergence was easy to spot, and the pullback didn’t hit my stop, which helps to affirm that I’ve got my stop/target set about right for today’s market volatility.
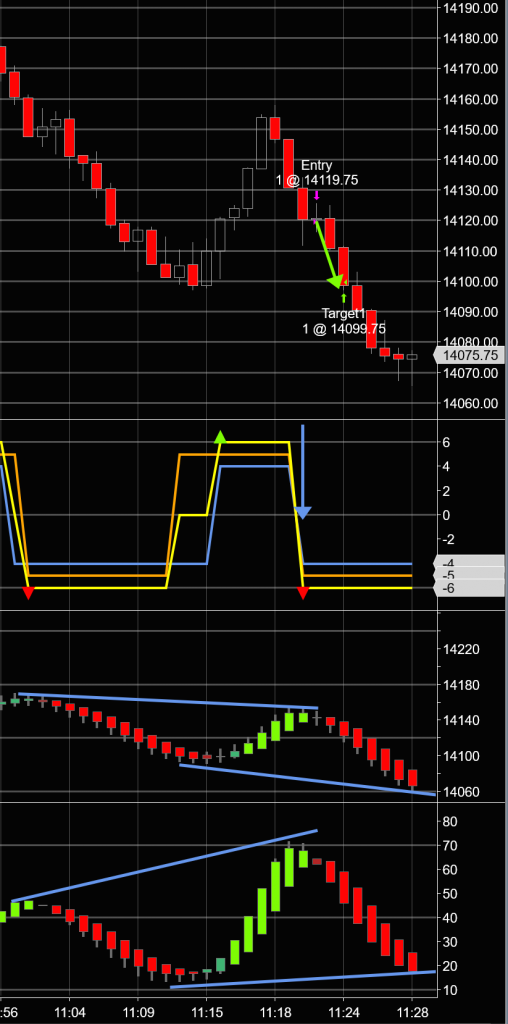
Trade 2: Loss = 20 Points
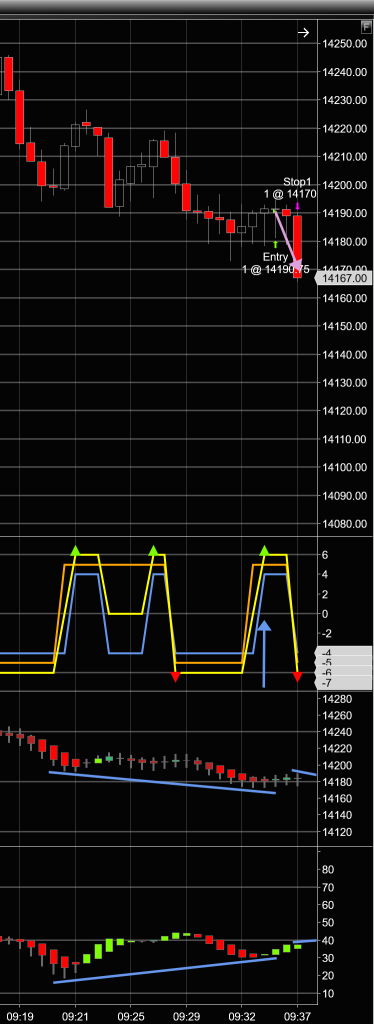
And back to net zero for the day. Post mortem on this trade doesn’t reveal anything I should have done differently. Bullish divergence was clear, so I won’t be shy about taking a trade in the future with similarly righteous provenance. Sometimes it just doesn’t work out, and this is one of those times.
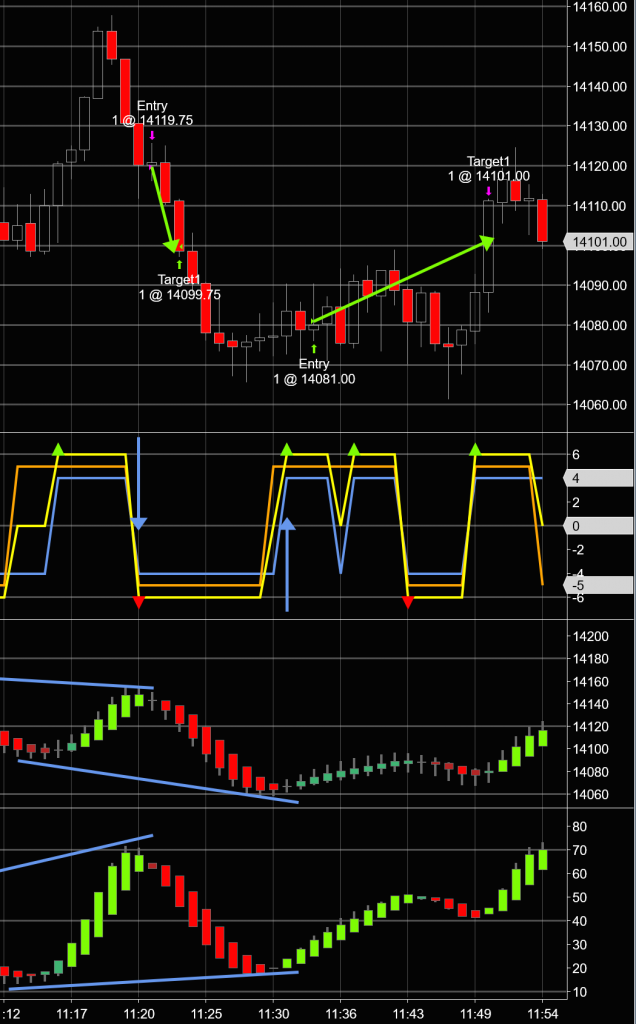
Trade 3: Profit = 20 Points
This trade totally makes up for the previous trade. Again, it’s all by the book and very gratifying.
Trade 4: Profit = 20 Points
Ignore the blue trend lines on the right. They for the nex trade that occurred on the heels of this one.
Again, the market is nice and smooth today, and this trade was very much by the book.
Trade 5: Profit = 20 Points
I got in this one a bit late (slippage simulation), but the results would have been the same (and the trade would have ended profitably a bit sooner) had I gotten in right at the close of the trigger bar. Still, I’m happy with this one.
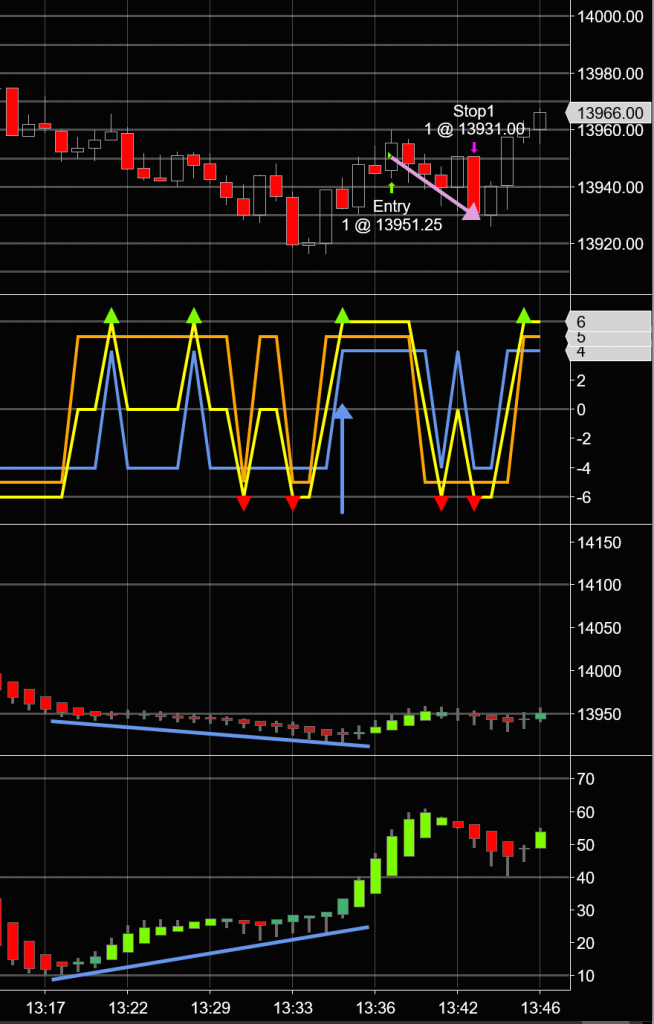
Trade 6: Profit = 20 Points
The 2-peak price trend line was pretty much horizontal, but the RSI 2-peak trend line was decidedly going down, so I decided to take this as a valid bearish divergence. The only trouble was, I was mucking about with some plumbing issues when this trade indication arrived, and I got in a bit late.
Only after I entered the trade did I notice that the trade-entry indication was for a bar whose closing price was 18 points higher than the bar I thought it was for. So I ended up entering the trade after the market had already moved 18 points.
So I was unwittingly chasing the market, which is a universally bad thing to do.
Still, the market had plenty of momentum, and the trade worked out just fine. (Lucky me.)
Trade 7: Profit = 20 Points
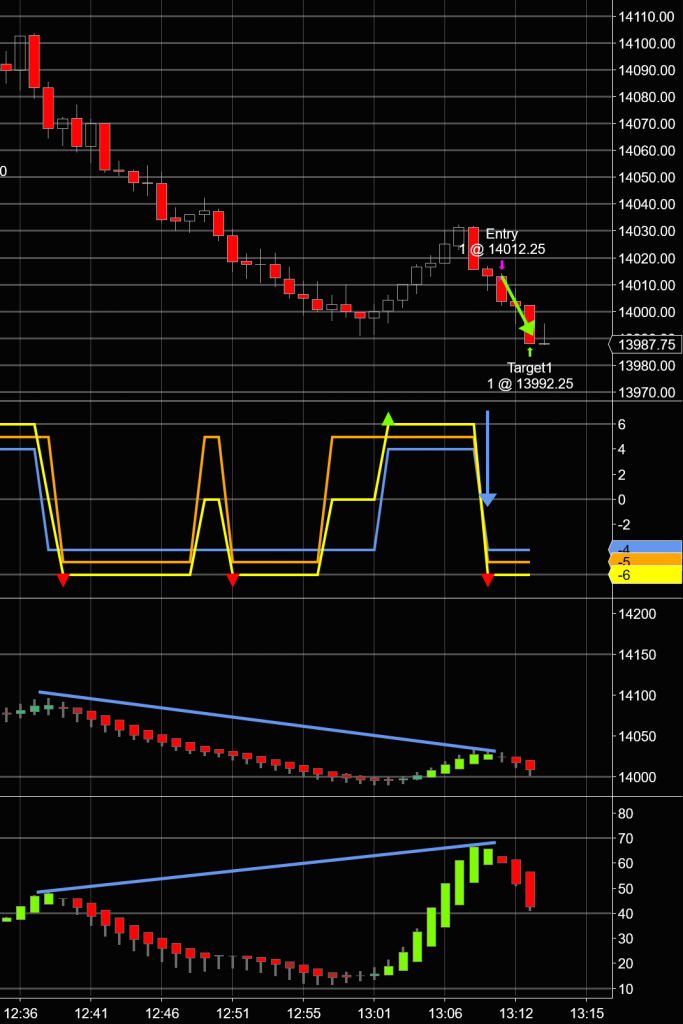
Perfect, and by the book. I love trades like these.
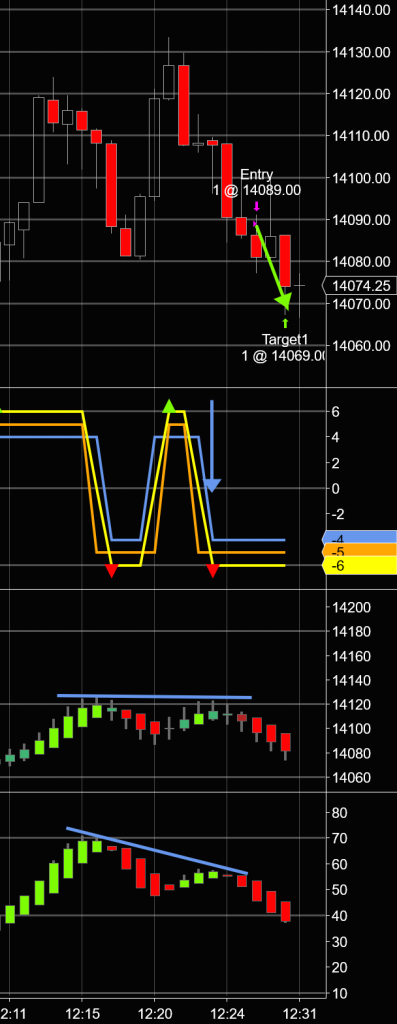
Trade 8: Loss = 20.25 Points
Here’s an example of me snatching defeat out of the jaws of victory. Had I entered this trade when entry was indicated, I would have made 20 points of profit. Instead, I entered late, chased the market, and suffered a loss of 20 points.
So do as I say, not as I do. (Or something.)
All in all, however, it was a pretty good day of trading, and I’m happy with the results.
Daily Statistics
Total Trades: 8
Good Trades: 6
Bad Trades: 2
Net Good Trades: 4
Net Profit: 79.75 Points in the NQ Mini NASDAQ market
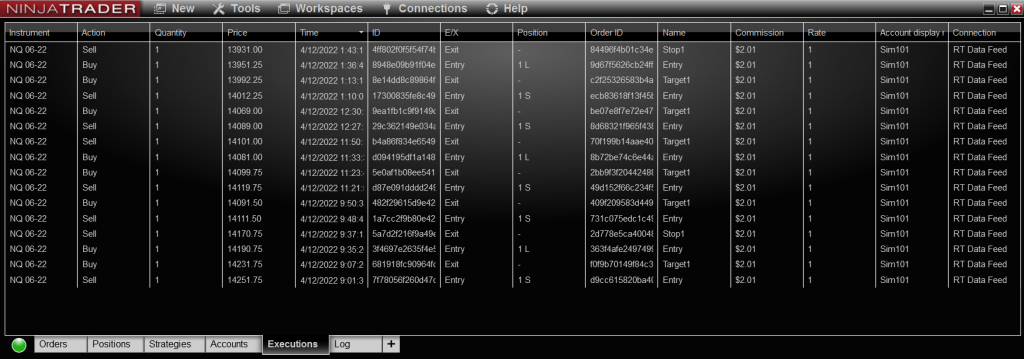
Executions
So you know I’m not hiding bad trades or making up good trades, here’s my execution log:
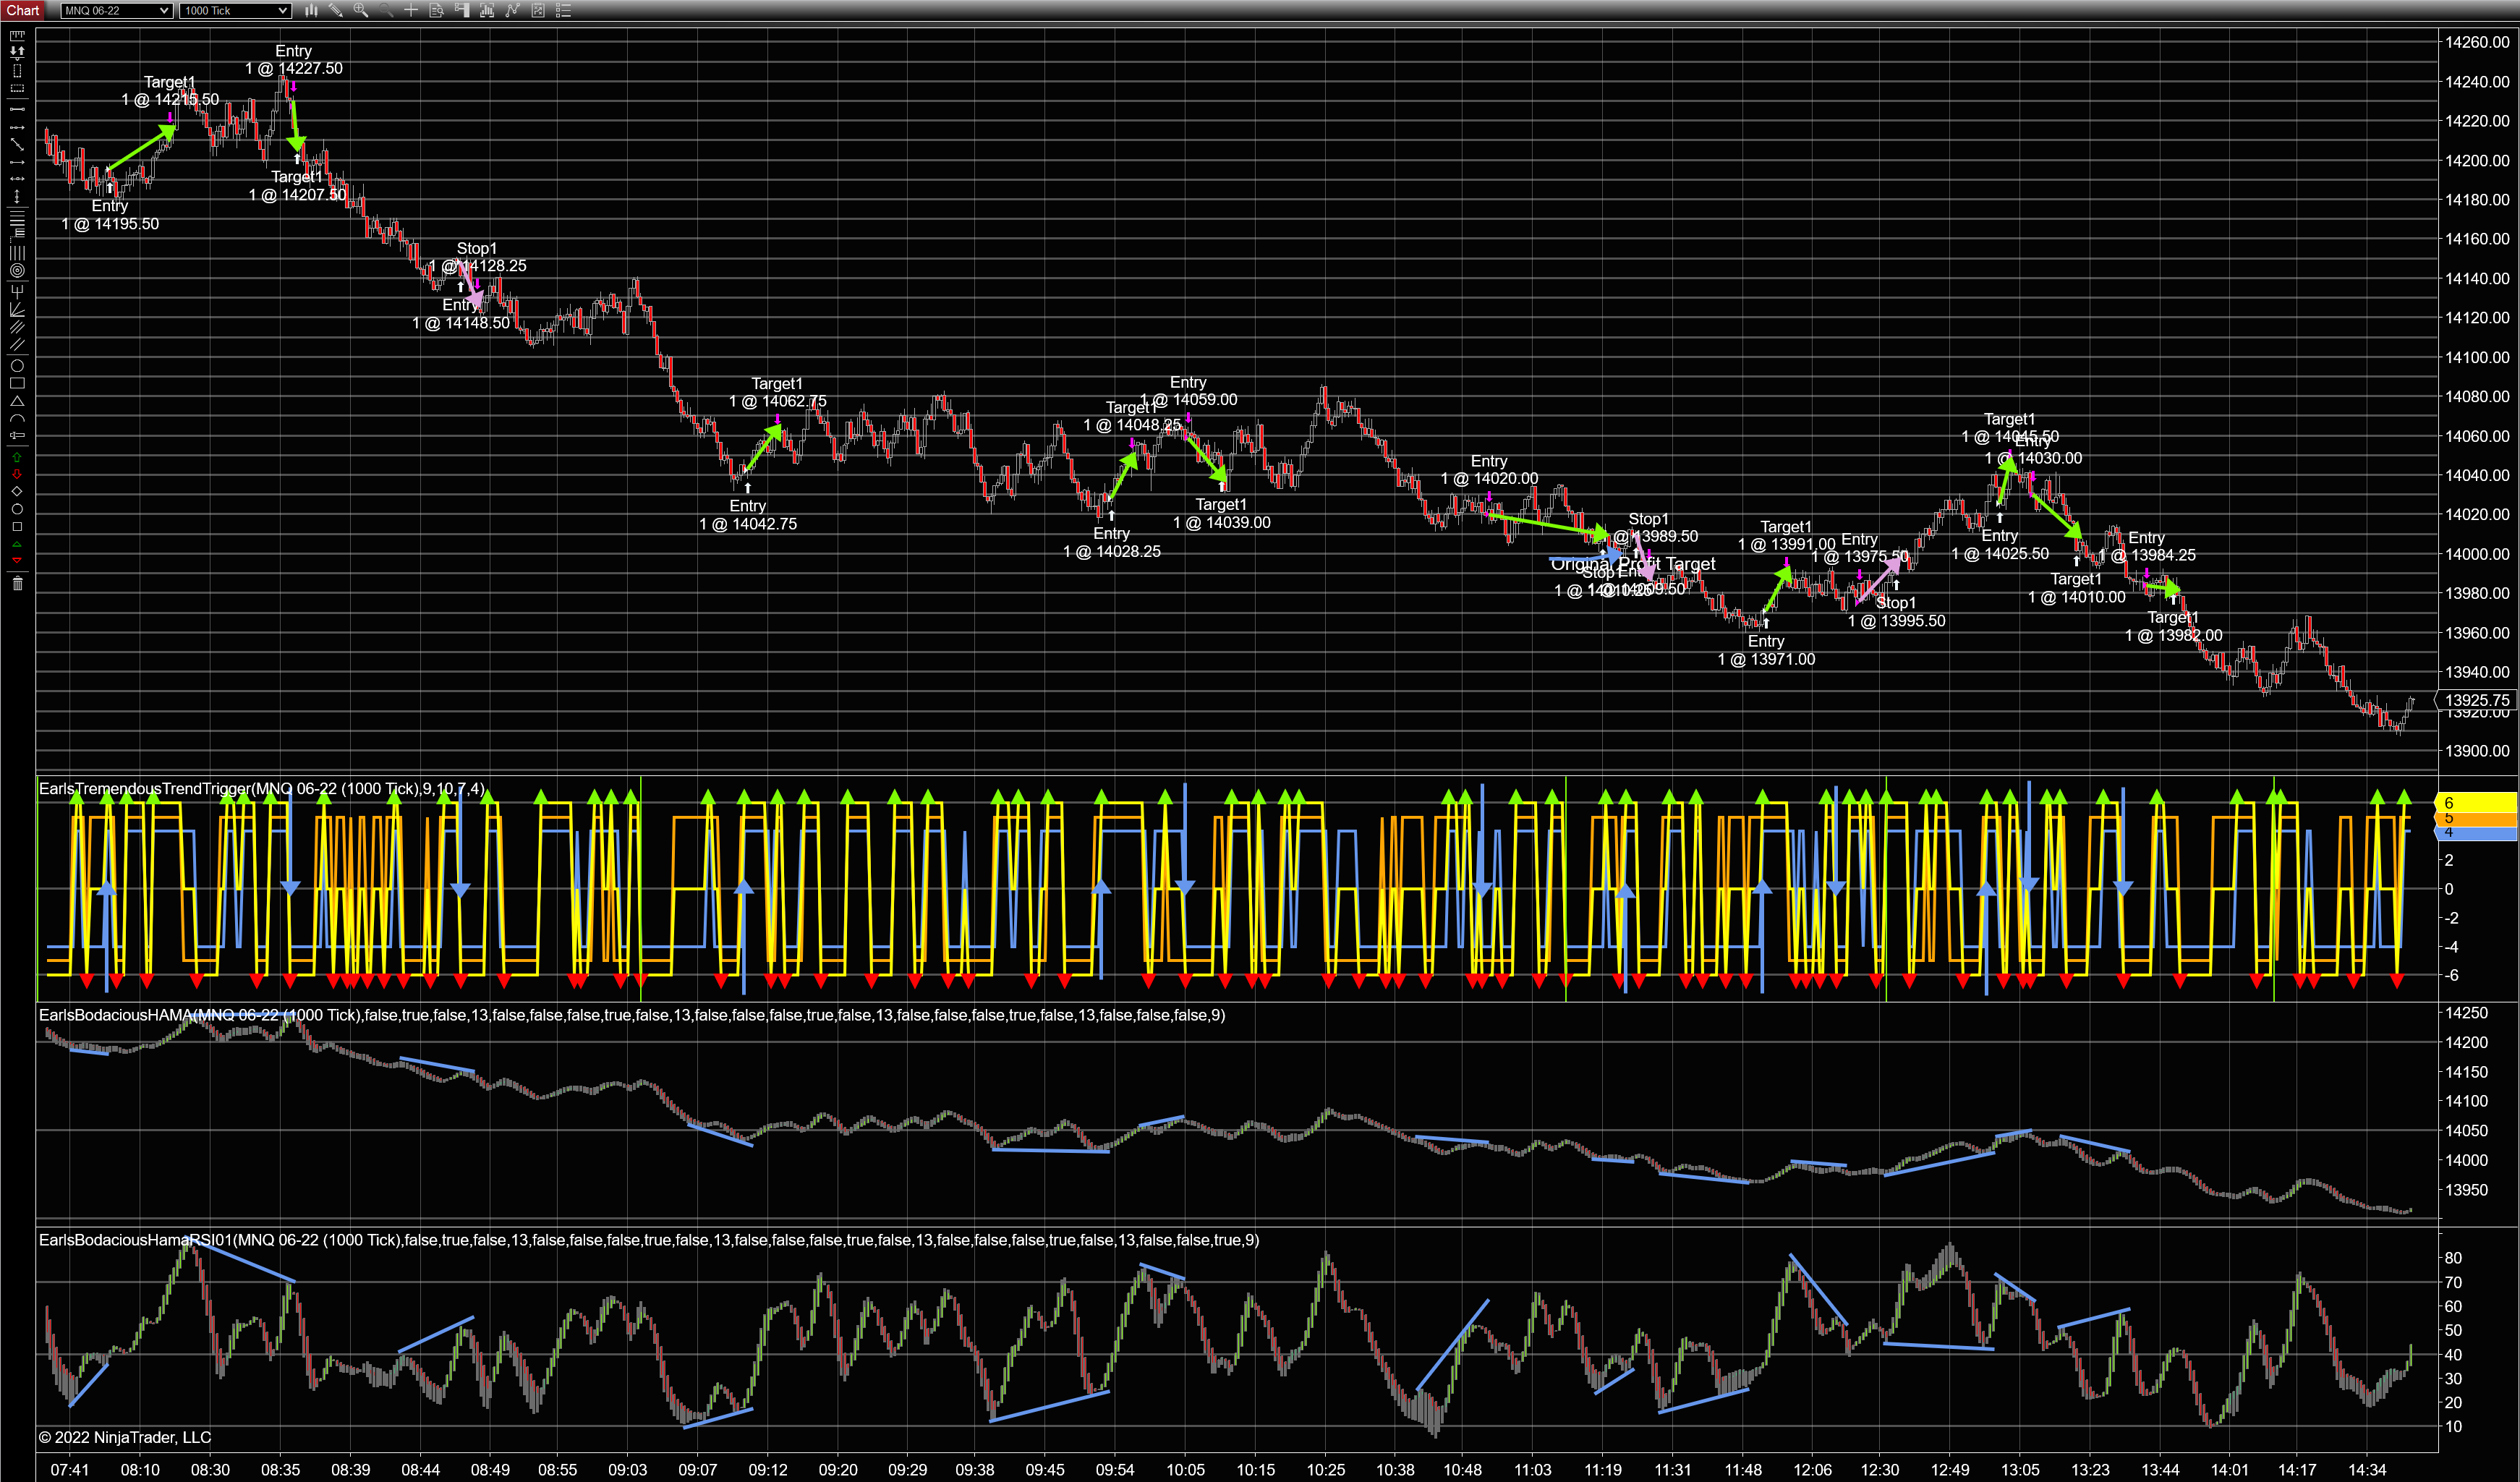
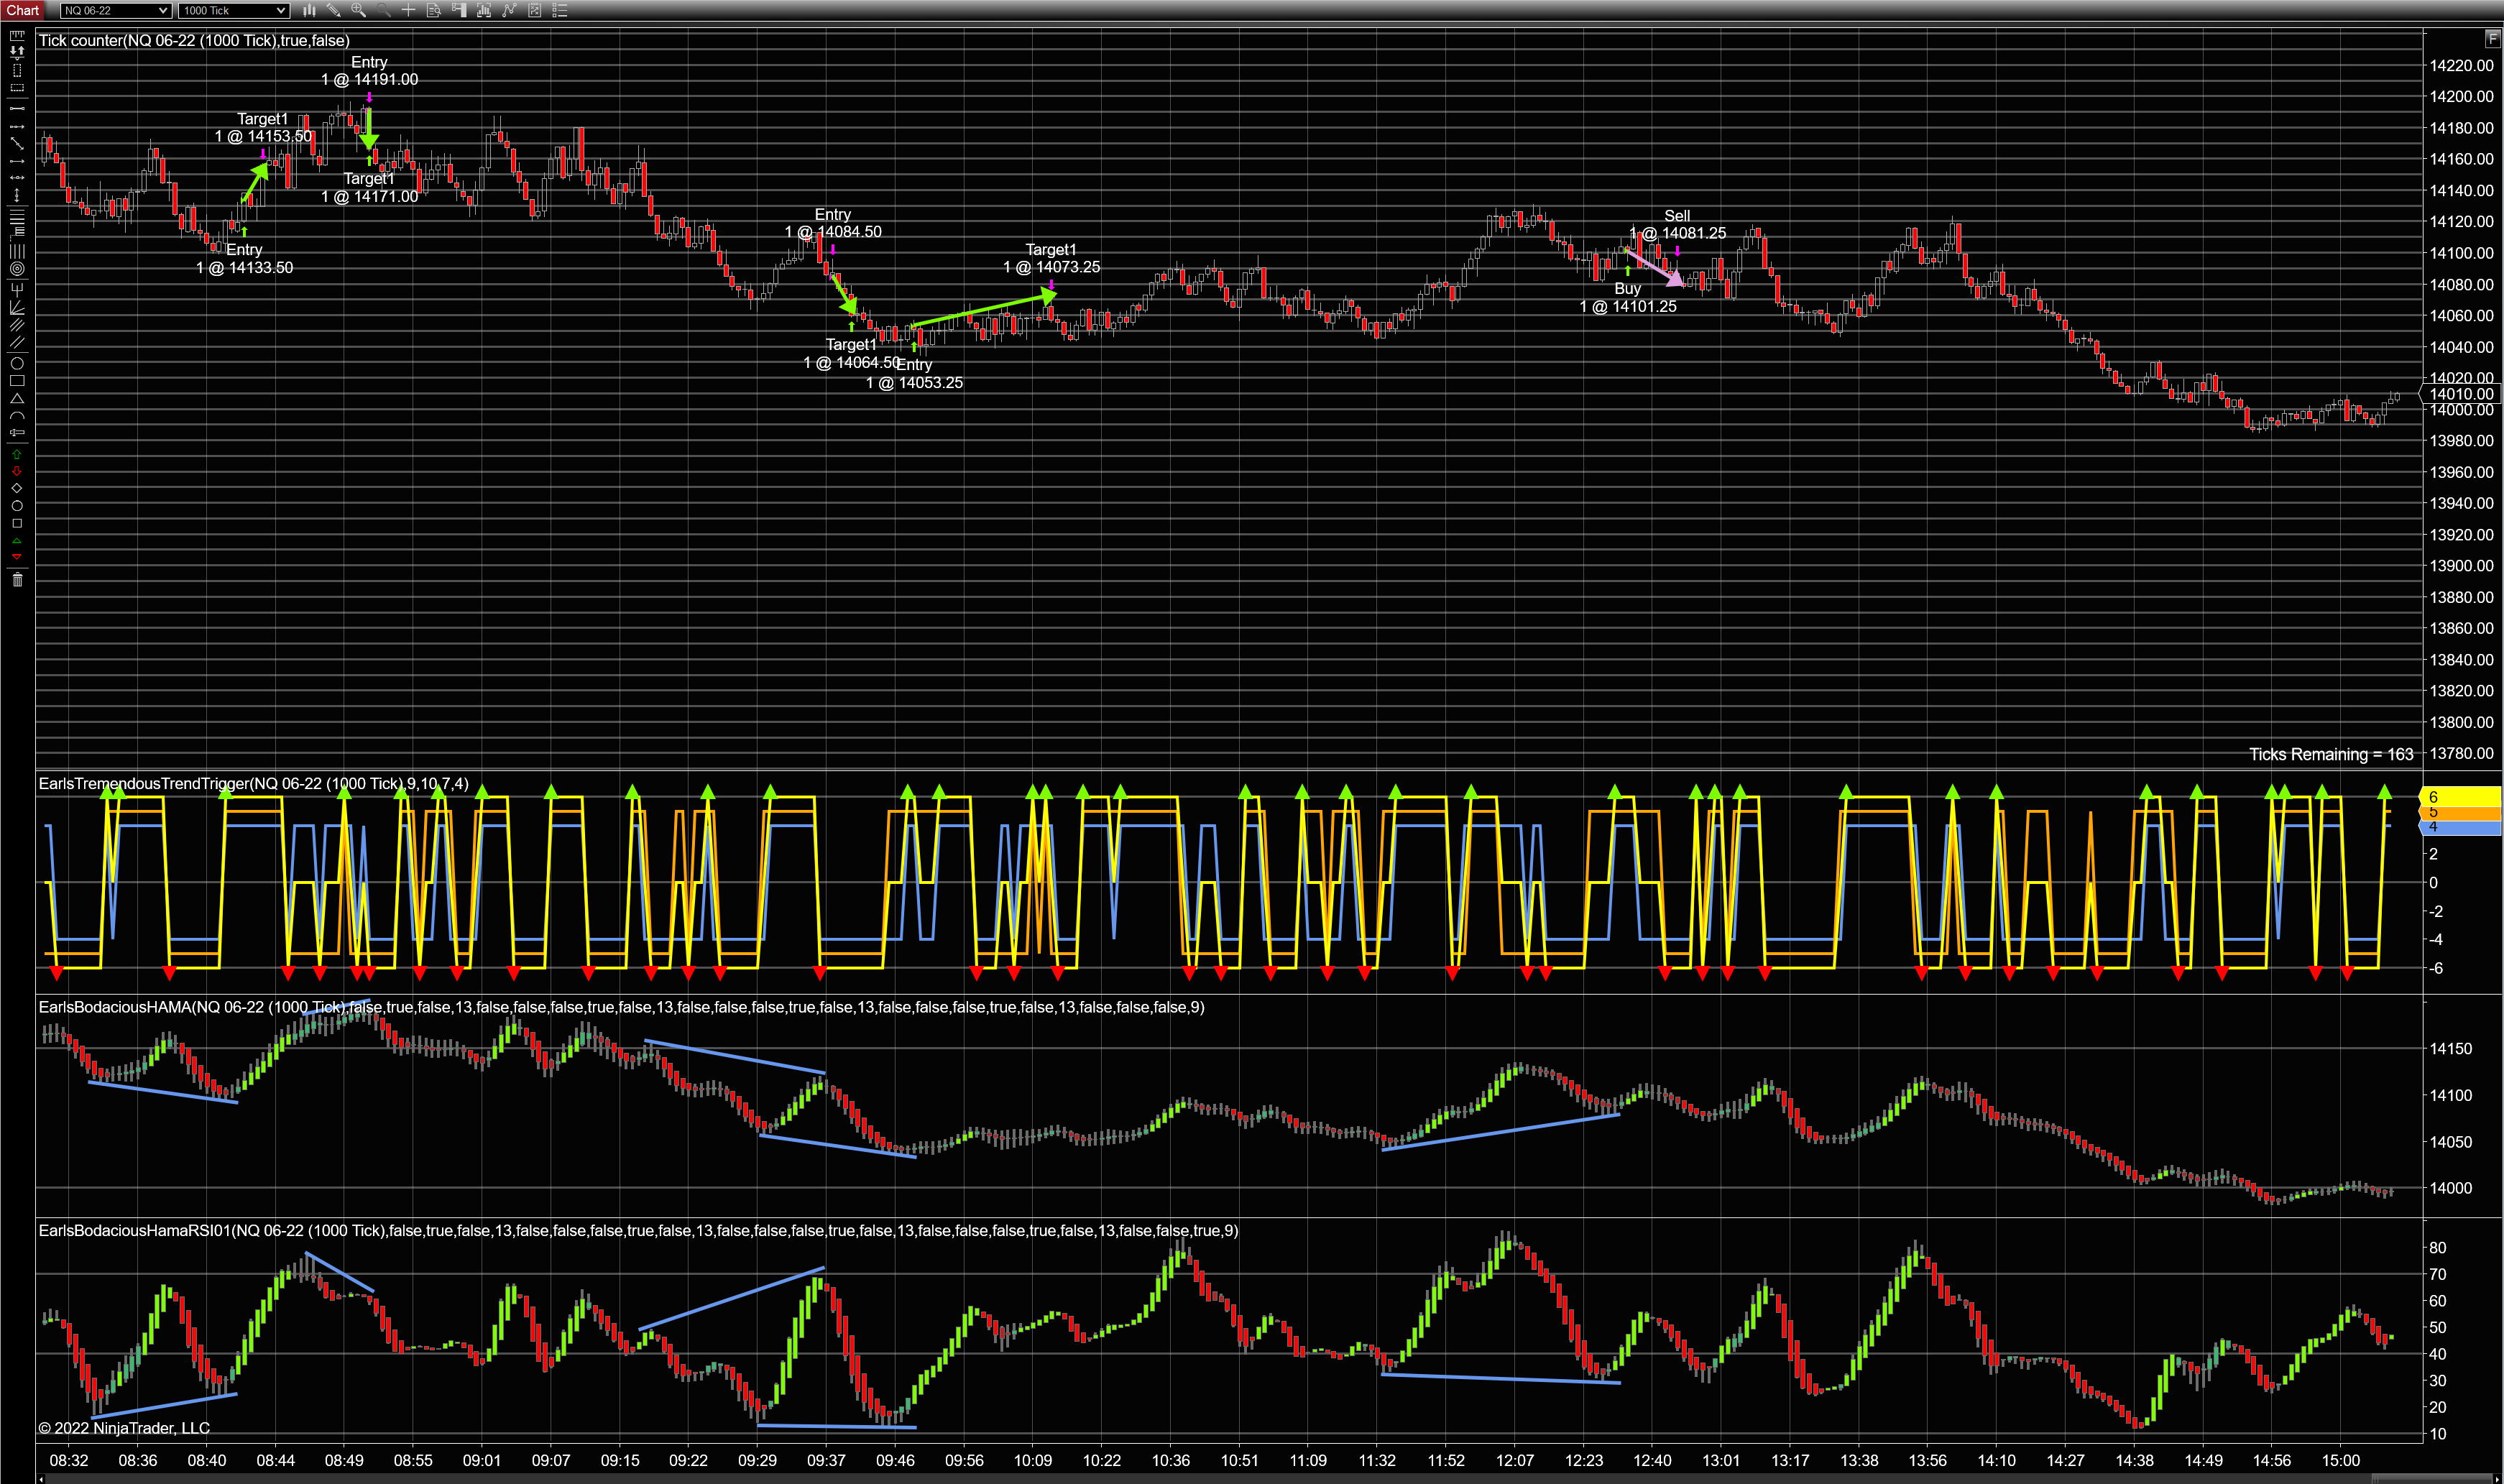
And here is a screen capture of the day’s run, showing all my trades in context:
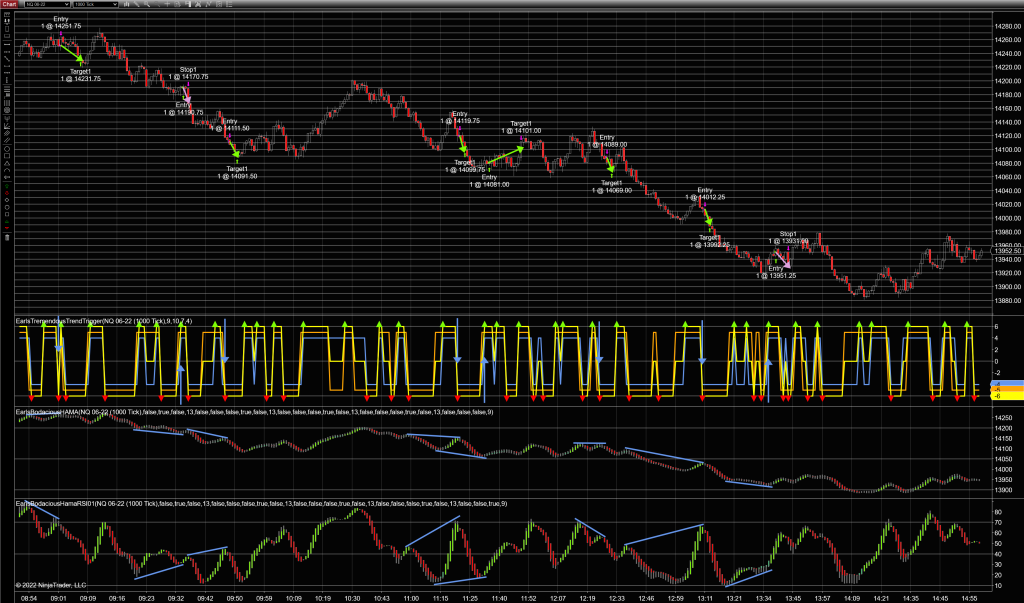
I was trying to do this and plumbing at the same time, so I’m pretty happy with the results. And don’t forget: I missed a few trades because I was soldering copper pipes together, so feel free to examine the screenshot above to find those and see if they would have increased or decreased my profit.
If you have any questions or comments, feel free to leave them below. And if you’re interested, click HERE to get my HAMA indicator.
Happy Trading, and always remember: It’s better to make less than you coulda than to lose more than you shoulda.