
Summary of Features
My SooperSmoother Indicator smooths out data and identifies reversals. And the data doesn’t have to be just price data. You can feed it RSI, Stochastics–whatever you want to feed into it. It will smooth it out while maintaining a decent fit, regardless of the data source.
Here’s what it looks like:
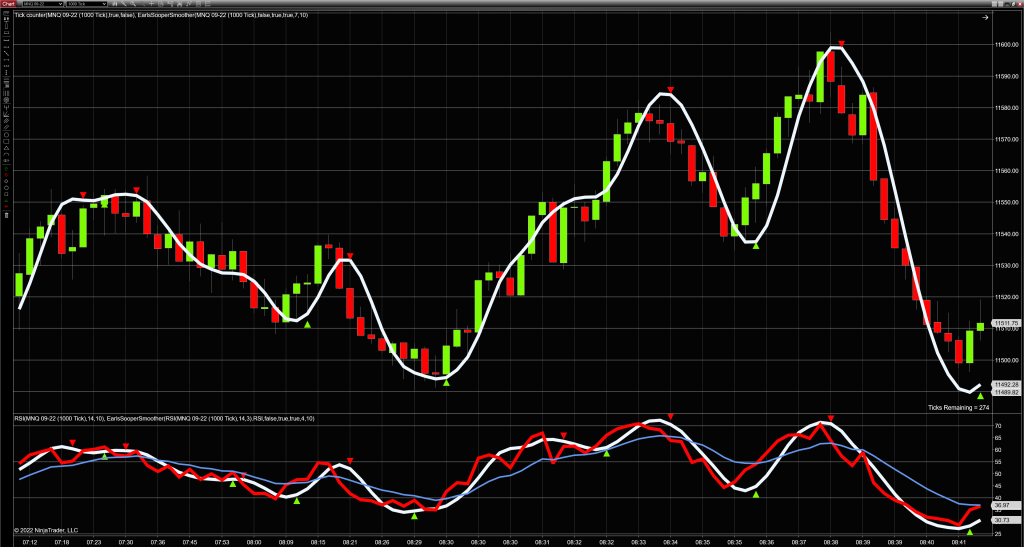
As you can see, the SooperSmoother hugs the source data pretty well without letting all those jaggies through to mess up your analysis and automated strategies. It even has (optional) triangles to indicate reversals–green for up, and red for down.
The SooperSmoother indicator is applied to the price data in the upper panel, and to RSI in the lower panel. (The blue line is just RSI-Smooth with the same period as the SooperSmoother indicator has to show the difference between the two.)
And since the SooperSmoother indicator can be applied to both price data and RSI curves, it can also be used to more easily spot divergences.
Get It!
To download my SooperSmoother Indicator, click HERE. It’s absolutely FREE.
But please read the user manual before using it. You can download the user manual HERE.
Happy Trading
And remember: It’s always better to make less than you coulda than to lose more than you shoulda.