
Summary of Features
The best thing about my Bodacious HAMA Indicator is not that it removes noise from price data. All HAMA indicators do that.
The best thing about my HAMA indicator is its ability to help you see divergence at a glance. Read on to see what I mean.
Here’s a snapshot of the NASDAQ market with the standard RSI indicator on a 1000-Tick chart:
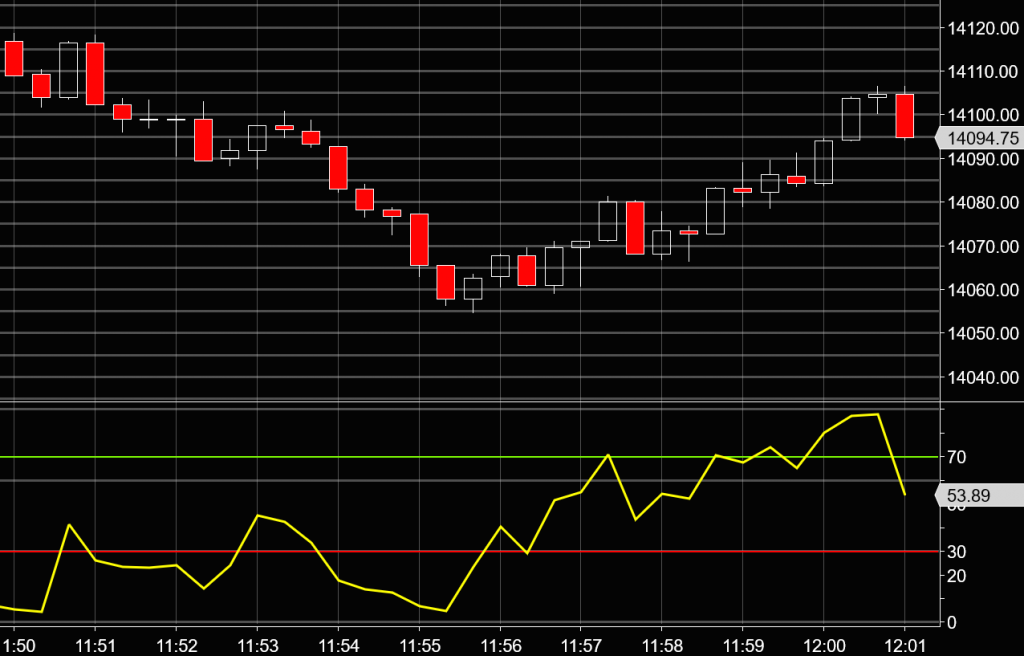
Can you spot the bullish divergence? It’s there, but with so much noise, it’s easy to miss. Even worse, it’s easy to see things that aren’t really there, making your trading decisions even more difficult and fraught with danger.
But using the RSIFilter configuration checkbox on my Bodacious HAMA indicator can help make spotting divergences a lot easier. By having two of my HAMA indicators in separate panels, identically configured except that one has RSIFilter turned ON, and the other one has RSIFilter turned OFF, divergences can be a lot easier to spot. Here’s the same price data, but with two of my HAMA indicators configured as described:
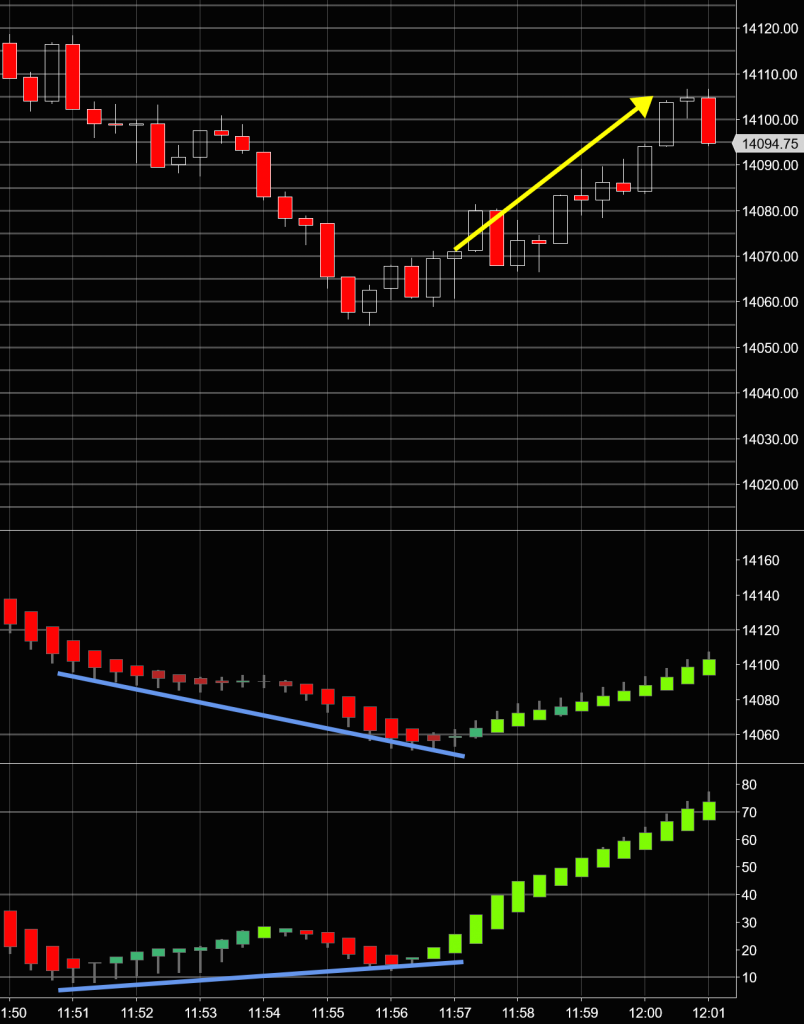
Please note that the blue lines showing divergence and yellow arrow showing subsequent price move are not part of the indicator, but were applied manually in order to clarify and to communicate usage.
As you can see, sufficient noise is removed from the peaks and valleys, making even the RSI-filtered indicator (on the bottom) silky smooth. You don’t even need to look at the price chart to know when divergence has happened. My HAMA indicators tell the whole story in this example.
Get It!
To purchase my Bodacious HAMA Indicator, click HERE. It’s only $24. Heck, you could pay for that with one successful trade on a single position in just about any futures market.
Happy Trading
And remember: It’s always better to make less than you coulda than to lose more than you shoulda.