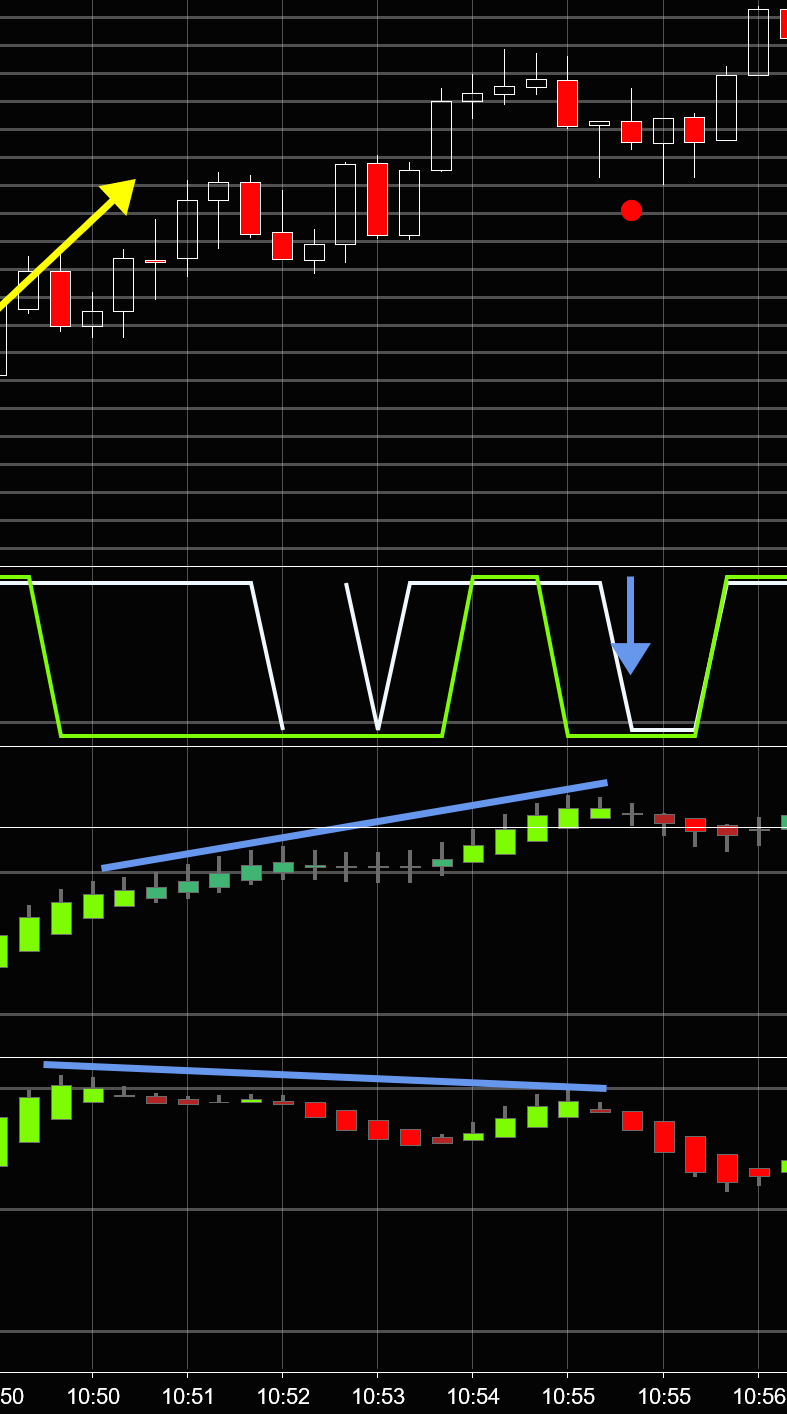
When I began wading in the shallow end of the day-trading pool, I used time-based charts, pretty much like everyone else. All the indicators, all the charts, all the cool tools everyone built seemed to be designed for–and worked best with–minute-charts.
And why not? Most every graph you see uses time as the X-axis.
But tick-charts had a special appeal to me that I couldn’t help but explore.
With minute-charts, it’s easy for anomalous activity–like massive institutional buys and dumps–get buried. If a bar in a five-minute chart has 20,000 more transactions than the previous bar, information is lost. Were those transactions spread out over the entire five minutes the bar was being painted? Or did they all take place in just a few seconds?
It’s easy for anomalous activity to get buried in minute charts. Even in one-minute charts, a burst of activity that takes just a couple of seconds will get averaged out over the entire 60-second duration of the bar.
But with tick-based charts, it’s one transaction, one vote, because each bar is made up of the same number of transactions. And the bar times provide the speed at which the transactions take place, which is just another way of expressing volume.
So that sudden buy/dump of 20,000 shares/contracts will be spread over several bars (unless you’re using a 20,000-tick chart, but who does that?), allowing you to determine the degree of anomalosity…
anomalousness? anomalousitude… anomalousification?
…to determine just how anomalous the sudden activity was.
And on a fundamental level, trend lines just seem to fit better and work better on tick-based charts. A burst of activity will likely extend the bar length of a time-based chart, but a burst of activity on a tick chart also extends over several bars (due to that one-transaction/one-vote thing), making trend lines fit better, capturing more peaks and valleys.
Check for yourself whether this is true. You might be surprised.
So when I began developing indicators for NinjaTrader, I decided to use tick-based charts exclusively.
So far, it’s worked out pretty well, and I haven’t looked back.


Good luck.